Engage 6.7
The Engage includes the following new features.
Send process maps to Simul8 from the Engage desktop app
Now, you can quickly send process maps from the Engage desktop app to Simul8 for simulation and analysis. The integration between desktop app and Simul8 saves time, reduces errors, and minimizes risk by making it easier to test and understand how process changes can improve performance before you implement them. For more information, go to Send a process map to Simul8.
Archive inactive templates in the sandbox
Now, data architects can archive inactive, outdated, or experimental templates instead of deleting them. Archiving helps data architects manage templates more efficiently. Archived templates are hidden from view in the desktop app, so users can only access approved templates and methodologies when creating new projects and tools. For more information, go to Archive or restore a template.
Engage web app 23 July 2025
The Engage web app includes the following new feature.
Owner-started workflow projects
Users can now start a workflow project from any idea that they own in the hopper when data architects enable owner-started projects in the sandbox. Enabling owner-started projects saves time and prevents a backlog of unstarted projects by allowing idea owners to start a project from the hopper at their convenience.
If you are a data architect, go to Customize the Workflow page to learn how to enable owner-started projects. If you are an idea owner, go to Start a workflow project to learn how to create an owner-started project.
Engage web app 25 June 2025
The Engage web app includes the following new features.
Quick Start projects for steering committee members
Steering committee members can now skip the first two stages of workflow when data architects enable Quick Start projects in the sandbox. Quick Start projects allow steering committee members to start projects that are ready to go in the Active stage.
If you are a data architect, go to Customize the Workflow page to learn how to enable Quick Start projects. If you are a steering committee member, go to Start a workflow project to learn how to create a Quick Start project.
New API endpoint to create non-workflow projects
A new Engage API endpoint allows external systems to automatically create non-workflow projects and ideas quickly and easily.
For information about how to create, edit, and revoke tokens, go to System settings. For details about the expected request and response structures used by the Engage API, go to Use the Engage API.
Engage web app 16 April 2025
The Engage web app includes the following new features.
New API endpoint to create and submit a project idea
Ideas for projects in Engage may originate from work or data recorded in another application. This new API endpoint in Engage allows data architects to configure external applications to automatically send a secure request to an Engage subscription. This request creates an idea with specified data values and automatically submits it for review.
For information about how to create, edit, and revoke tokens, go to System settings. For details about the expected request and response structures used by the Engage API, go to Use the Engage API.
New tokens can be named and edited
Subscriptions that manage multiple API tokens can specify a name for each token to help them differentiate tokens. Also, data architects can change the name of tokens, shorten or extend the expiration date of tokens, and change the token permissions without creating a new token. For more information, go to System settings.
Engage 6.6
Engage 6.6 includes the following new features.
P-Diagram and Checklist are now available
Include non-workflow projects in the dashboard
Now, data architects can determine whether the Include in dashboard option is checked or unchecked in the desktop for administrators, data managers, or data architects who create or edit non-workflow projects. For more information, go to System settings.
Hide non-workflow project templates
By default, when a user wants to create a new project from the desktop app, they can select from a list of non-workflow project templates. Now, data architects can set the default to hide the list of non-workflow projects templates, which prevents users from unintentionally circumventing the workflow process. For more information, go to System settings.
Engage web app 04 December 2024
The Engage web app includes the following new feature.
Share reports
Prior to this release, the only way to share a dashboard report with someone else was to make the report public for all users to see and use. Now, anyone can share their private report with a specific stakeholder or a select group of stakeholders. Additionally, shared private reports are grouped together for quick access to the information that is most important to you and the stakeholders you specify. For more information, go to Share a report.
Engage web app 30 October 2024
The Engage web app includes the following new features.
Custom dashboard summary palettes
Engage 6.5 includes the following new features.
Assign custom colors to distinct groups in dashboard summaries to make your graphs and tables clearer and more meaningful. For example, create a palette of red, orange, and yellow to indicate high, medium, and low priority or create a palette of green, yellow, and black to indicate belt levels. For more information, go to Create summaries.
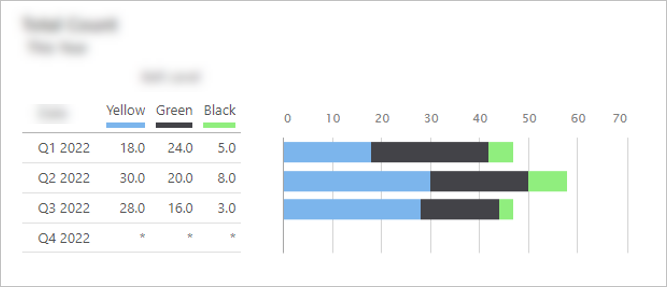
Projects grouped by belt levels (green, yellow, and black) with default graph colors
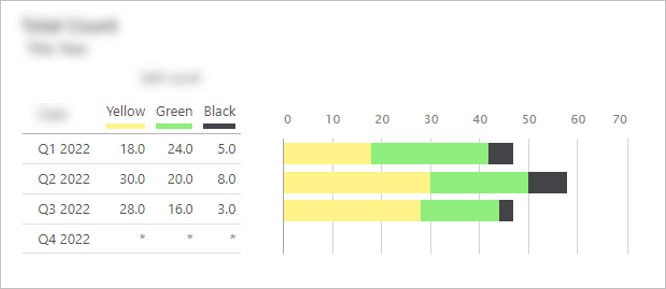
Projects grouped by belt levels (green, yellow, and black) with custom graph colors
Enhanced column set formatting
Apply any number of conditions to your column set to meet the requirements of your scenario. For example, choose from a variety of icons or colors to show varying degrees of savings or past due warnings. For more information, go toCreate column sets.
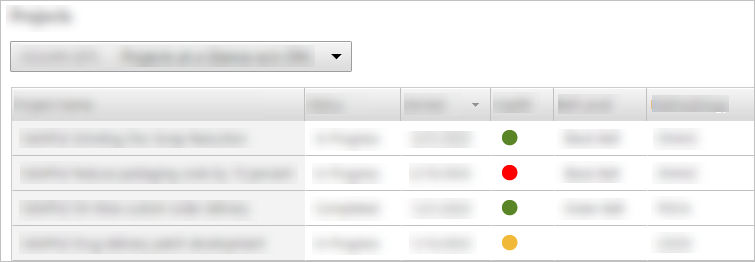
The following column set shows a red circle for overdue projects, a yellow circle for projects that are due within a week, and a green circle for projects that are not overdue.
Summary editor improvements
- Exclude empty groups
-
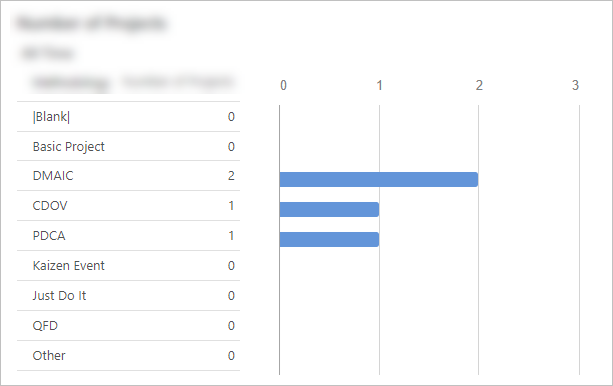
Before
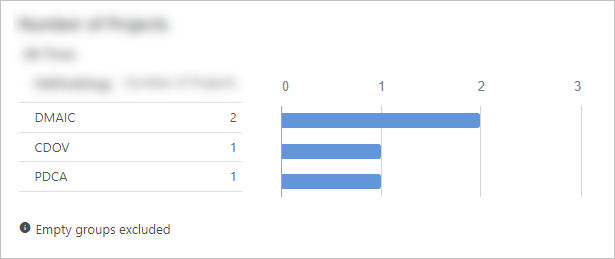
After
- Sort in ascending or descending order
-
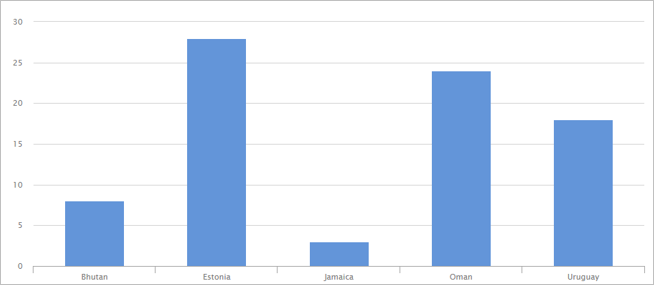
Before
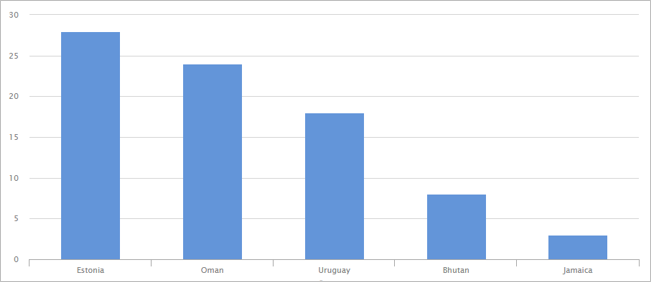
After
Engage 6.5
Engage 6.5 includes the following new feature.
View managed data in projects
With Engage 6.5, data architects can use the sandbox template editor to connect managed data to controls on a form. The previous release of Engage allowed data managers and data architects to bulk import data managed in external systems so the data could be included in dashboard reports. Now, users can view the managed data within the context of the user’s individual projects. For more information, go to What you can do with data fields.
Engage 6.4
Engage 6.4 includes the following new features.
Managed data for projects
Managed data for projects refers to sensitive project data, such as financial or savings data, that is critical to accurate dashboard reporting. To protect this sensitive data, it is stored and controlled externally by users with elevated permissions. With this release of Engage, users assigned to the new role of Data Manager can import managed data. Because managed data is read-only, users cannot edit the values. This eliminates manual re-entry and user error and increases the integrity of your dashboard reports. For more information, go to What is a data field?.
New Templates for 8D Methodology
The new 8D Project template and four new 8D forms are now available. Use the 8D Project template to conduct a project according to the eight disciplines (8D) for identifying, correcting, and preventing recurring problems. The 8D Project template includes the following new forms, which can be used in the project or on their own: CATWOE, Communication Plan, Impact Analysis, and Is/Is Not. For more information, go to 8D Methodology.
Pause, cancel, and resume workflow projects
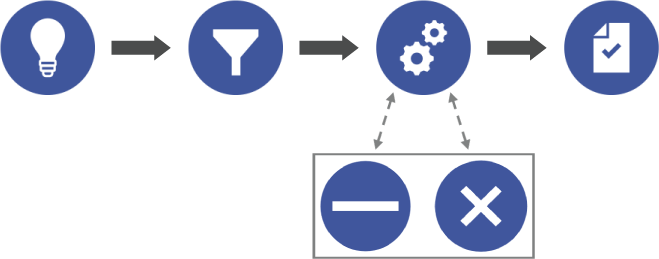
Data architects and steering committee members can move active projects to the Paused and Canceled stages.
Engage 6.3
Engage 6.3 includes the following new features.
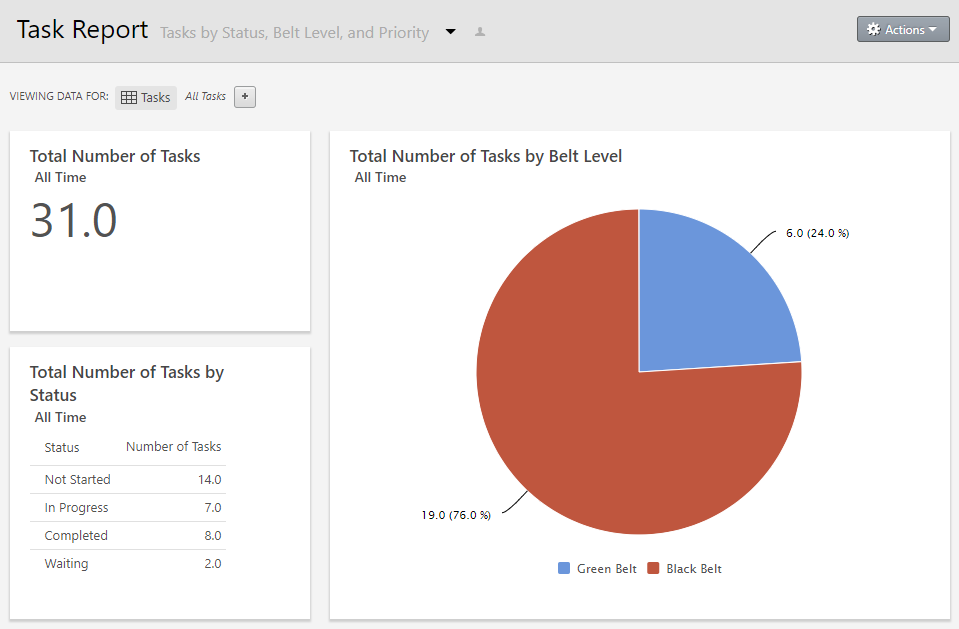
Gain even more insight with task reports
Engage is now available in Chinese, Japanese, Korean, and Portuguese
New customers can choose to set up an Engage subscription in Chinese, Japanese, Korean, or Portuguese. Contact Minitab to learn more.
Save dashboard reports
Now, when you want to archive or share a dashboard report, choose . Engage uses your browser's print options to save the report as a PDF. For more information, go to What is a dashboard report?.
Engage 6.2
Engage 6.2 includes the following new feature.
Engage is now available in French, German, and Spanish
New customers can choose to set up an Engage subscription in French, German, or Spanish. Contact Minitab to learn more.
Engage 6.1
Engage 6.1 includes the following new features.
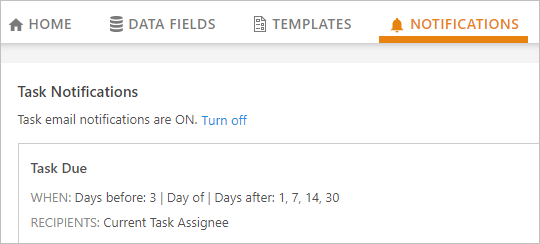
Keep users on task
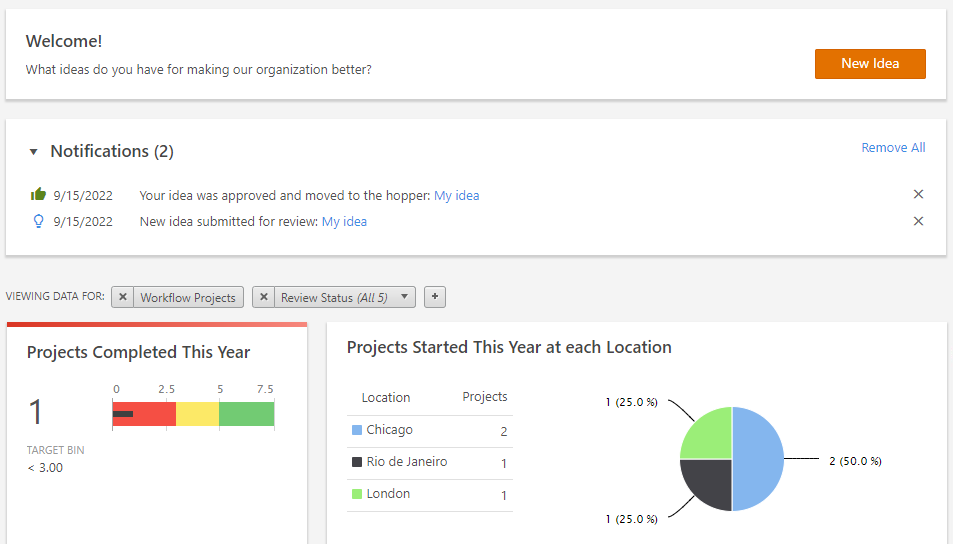
More insight for everyone
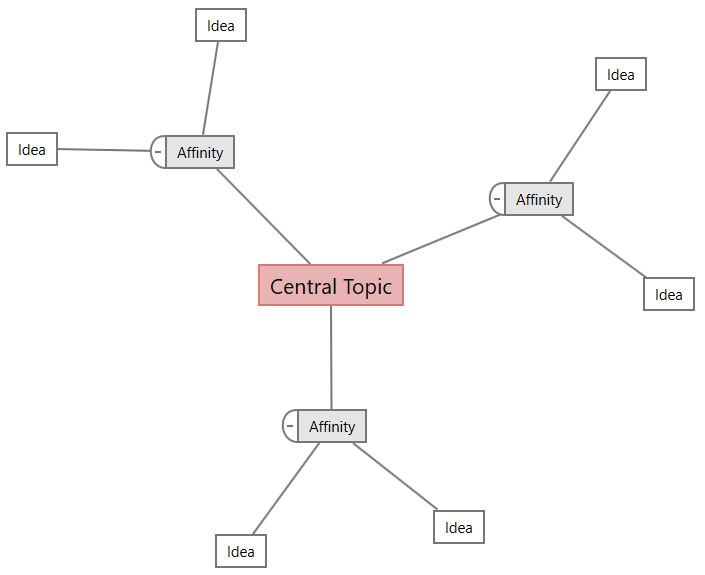
Quickly organize ideas for a big picture view
At-a-glance insight into initiatives
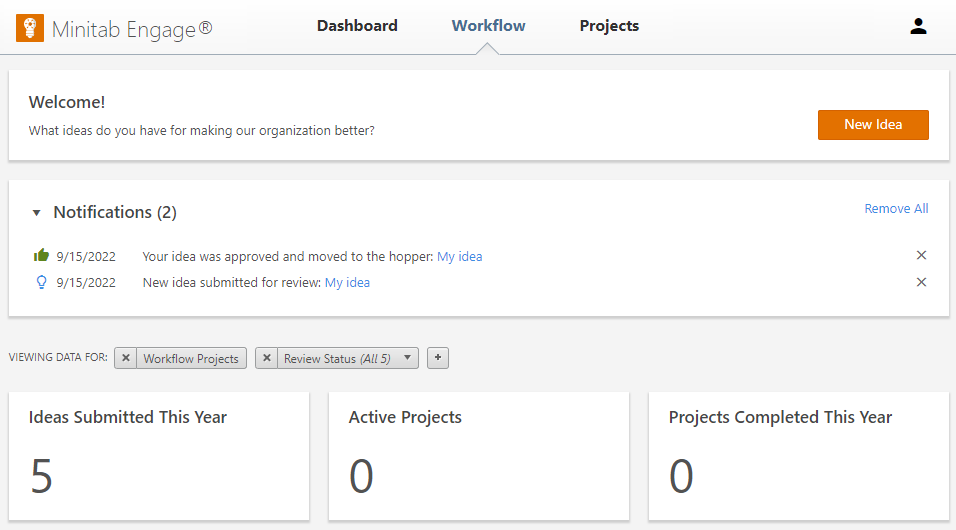
Submit ideas anytime...anywhere
Now, anyone in your subscription can submit ideas in the web app without having the desktop app installed. With the new online idea form add-on, you can add idea submitters to your subscription so you can gather valuable ideas for improvement or innovation from everyone in your organization. Then, steering committee members can review ideas and funnel the best ones to project leaders to implement. For more information, go Create, submit, and view ideas.
Talk to Minitab about how to enable this optional add-on to your Engage subscription.
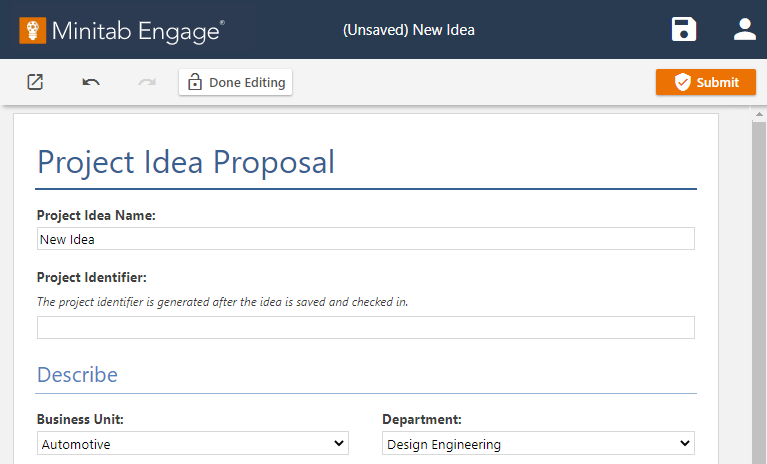
Access data through the API
Now, data architects can create API tokens so you can include Engage data in external business intelligence systems and applications for a consolidated view of your organization's status. For more information, go System settings.
