Open workflow in the sandbox
- In the web app, select Design. Create a sandbox if one is not already available.
- In the sandbox, select Workflow.
- Under the Workflow Configuration section, view the editable workflow components.
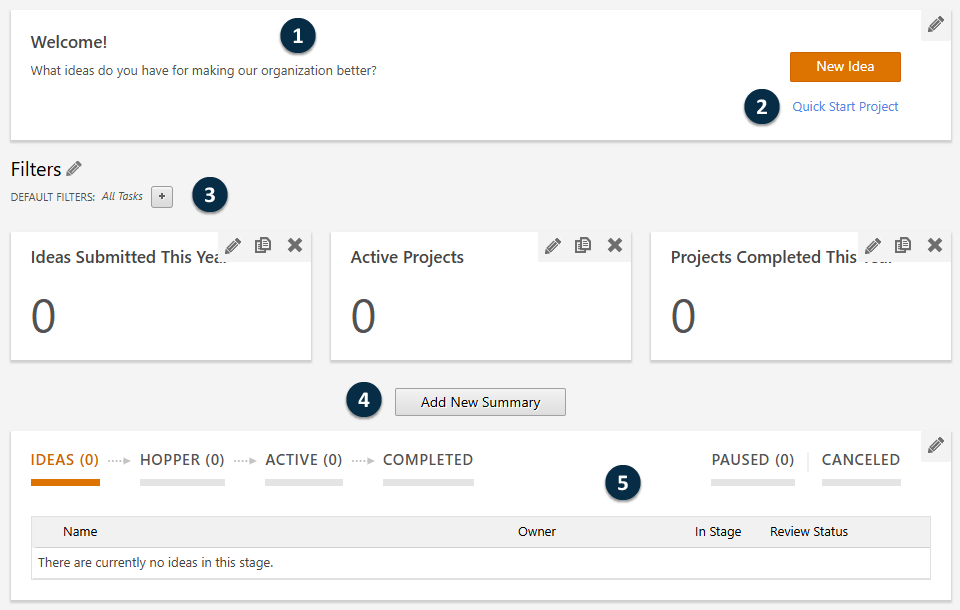
- 1: Call-to-action message
- Text to encourage users to submit ideas, make them aware of changes, provide instructions, and so on.
- 2: Quick Start Project link for steering committee members
- Allows steering committee members to skip the first two stages of workflow and start projects immediately from the Active stage.
- 3: Filters
- Allows you to focus on a subset of ideas and projects based on a condition, such as region, location, or project status.
- 4: Summaries
- Displays aggregate data from ideas and projects, such as the number of ideas submitted this year, the number of active projects, or the total number of completed projects.
- 5: Column sets
- Determines the fields that are displayed for ideas and projects within each workflow stage.
- When you finish your changes in the sandbox and you are satisfied with how they will be applied in the live site, select Publish Changes.
Edit the call-to-action message
You can edit the call-to-action message to match the terminology, goals, and values of your
organization. To edit the call-to-action message, select the edit button  in the call-to-action section. In the
Edit Call To Action dialog box, enter the title and text to display.
in the call-to-action section. In the
Edit Call To Action dialog box, enter the title and text to display.
Quick Start Project link for steering committee members
By default, the Quick Start Project link is hidden on the Workflow page.
To show the Quick Start Project link so steering committee members can start projects from the Active stage, in Workflow Configuration, under Quick Start, select Turn on Quick Start for SC members. For more information, go to Set preferences for starting a workflow project.
Edit filters to limit the scope of the report
You can edit filters to segment summarized data by region, location, belt level, and so on. For example, you might create filters to show only projects by department or savings by location.
To create a new filter, select the edit button in the filters section.
To edit an existing filter, select the edit button next
to the filter to edit.
Editing filters on the Workflow sandbox page is similar to editing filters for a dashboard report. For more information, go to Create filters.
Note
Workflow filters include three filters that you cannot edit or delete.
- My Ideas and Projects
- All ideas that you submitted and all projects that are assigned to you.
- I'm a Reviewer
- All ideas or projects that you are assigned to as a reviewer.
- Ready for My Review
- All ideas or projects that you are assigned to as a reviewer and are ready for your review.
Create and edit summaries for quick insight
You can create and edit summaries using graphs and tables to visualize the progress of the company's deployment. Summaries engage users by illustrating goals, targets, and trends at a glance.
To create a new summary, select Add New Summary.
To edit an existing summary, select the edit button next
tot he summary to edit.
Creating and editing summaries on the Workflow sandbox page is similar to creating and editing summaries for a dashboard report. For more information, go to Create summaries.
Edit column sets to display project data at each stage
Workflow consists of the following stages: Ideas, Hopper, Active, Paused, Canceled, and Completed. Each workflow stage has two column set views, a collapsed view and an expanded view.
You can edit column sets to determine the project data to display at each stage. Usually, you want to display the data that users are required to complete before the project can move to the next stage. You can also edit data fields to display images, colors, or text, based on conditions you set in the project data editor.
,
select the column set to edit, then complete any of the following tasks. - Add or delete data fields in the column set.
- Change the order of the columns in the column set. Select the drag handle
 and drag the data field up or down to
change its location.
and drag the data field up or down to
change its location. - Edit a specific data field in the column set. Select the edit button
 next
to the data field to change its display name, tool tip text, or relevant formatting
options.
next
to the data field to change its display name, tool tip text, or relevant formatting
options.
Example of editing a workflow column set
Show the data field, Risk, in the project details of the Hopper stage, then set conditions to color-code the risk values.
Note
To prevent this example from affecting the live site, discard any changes before you exit the sandbox.
- In the sandbox, select Workflow.
- In the stages section of the Workflow sandbox page, select Hopper, then select the edit button .
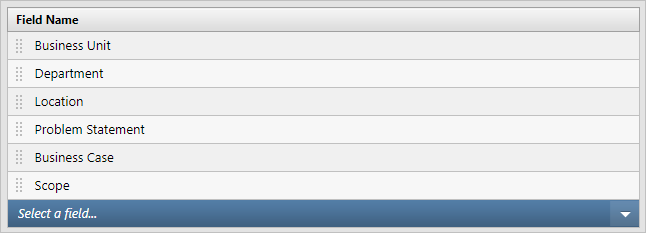
- Under Column Sets, select Hopper - Expanded View.
- Select
Select a field,
then choose
Risk
from the
Project Summary
category.
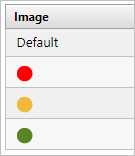
- Select the edit button
for Risk.
- Under
Image
select an image for each risk value: red for
High,
yellow for
Medium,
and green for
Low.
Then, select
OK.
- Select Done.