If workflow is on, then dashboard reports include only workflow projects in the Active, Paused, Canceled, and Completed stages and any non-workflow projects that have been included by administrators, data managers, or data architects. By default, workflow ideas in the Ideas and Hopper stages do not contribute to dashboard reports. To include ideas in a report, create or open a report in edit mode and select Include ideas in report. For more information, go to Create a report.
Report components
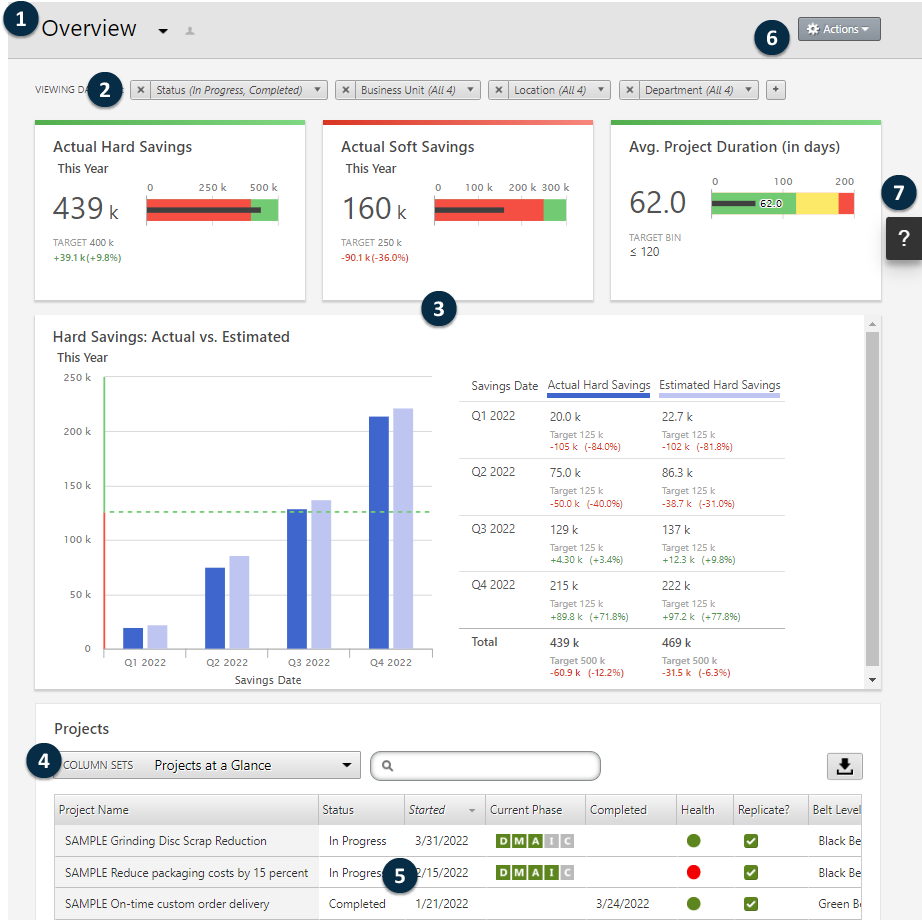
- 1: Reports list
- A list of available reports organized by private reports that you own, reports that are shared with you, and public reports.
- 2: Filters
- Allows you to focus on a subset of projects or tasks based on a condition, such as region, location, or project status.
- 3: Summaries
- Displays aggregate project or task data, such as the number of projects or tasks in each division or the average duration of projects or tasks. Summaries can also display optional targets.
- 4: Column sets
- Determines the fields that are displayed in the Projects or Tasks list.
- 5: Projects or Tasks list
- Displays a list of all projects or tasks that meet the criteria of the selected filters.
- 6: Actions menu
- Gives you access to common tasks, such as editing, copying, and creating new reports, saving a report as a PDF, and setting default reports.
- 7: Help button
- Opens the Help panel so you can access Help topics and instructional videos. From the Help panel on the Projects page, you can download the desktop app.
Choose a report
You can choose different reports to view different aspects of your deployment.
 beside the report name.
 Note
The dashboard refreshes approximately every 10 minutes. If projects or tasks do not appear in a report, then the project might have been saved to the repository after the dashboard was refreshed. If the projects or tasks still do not appear after a 10-minute interval, then they might not meet the report's filter criteria.
Set a default report
- To set a private default report, select the report you want to see after you sign in, then choose .
- To return to the company-wide default report, select your private default report, then choose .
Print a report as PDF
You can print a report as PDF so you can send it to others who do not have an Engage subscription. You can also print a report as PDF to create a snapshot of report data at a specific point in time.
Choose , then choose your browser's PDF option.