Note
This command is available with the Predictive Analytics Module. Click here for more information about how to activate the module.
In This Topic
Overview
- The model that the analysis selects is part of a pattern where the criterion improves. Typically, you want to make predictions from a model with as much prediction accuracy as possible.
- The model that the analysis selects is part of a pattern where the criterion is relatively flat. One or more models with similar model summary statistics have much fewer basis functions than the optimal model. Typically, a model with fewer basis functions gives a clearer picture of how each predictor variable affects the response values. If the difference in prediction accuracy for a smaller model is negligible, you can use the smaller model to evaluate the relationships between the response and the predictor variables.
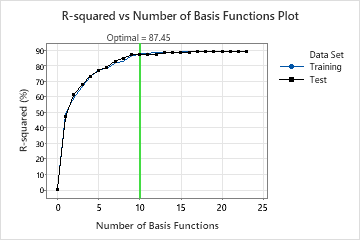
- The analyst chooses a smaller model that provides a clearer view of the most important variables.
- The analysis chooses a model because the basis functions are for variables that are easier to measure than the variables in another model.
- The analyst chooses a model because a particular region of the predictors is of interest.
Perform the analysis
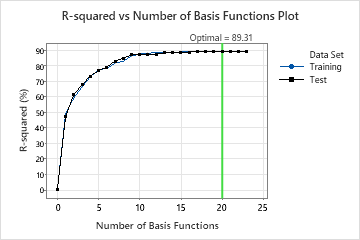
Select Select Alternative Model in the output. A dialog box opens that shows a plot of the criterion against the number of basis functions and a table that summarizes the steps.
Compare the criteria
To select an alternative model, select a point on the graph or a row in the table. Select Display Results to create the results for that model.
Once you display the results, you can select Predict to make predictions from the model. For more information, go to Predict new results for MARS® Regression.
Tip
To compare the output of two different analyses or reports, right-click the second item in the Navigator and choose Open in Split View.