Simple
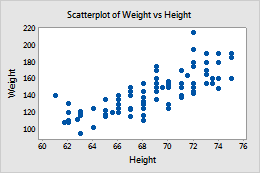
Create a scatterplot that displays the data values for a pair of variables at their (x, y) coordinates. For example, the following scatterplot shows the relationship between weight and height.
For more information, go to Create a simple scatterplot.
With Groups
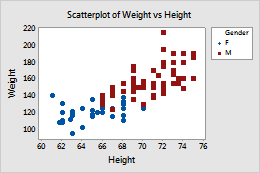
Create a scatterplot that displays the data values for pairs of variables at their (x, y) coordinates, divided into groups. Groups are represented by different colors and symbols. For example, the following scatterplot shows the relationship between weight and height for each gender.
For more information, go to Create a scatterplot with groups.
With Regression
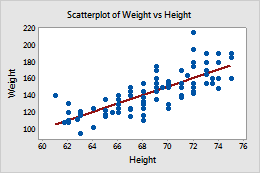
Create a scatterplot that displays the data values for a pair of variables at their (x, y) coordinates, and include a regression fit line. For example, the following scatterplot shows the relationship between height and weight, with a regression fit line that represents the relationship.
For more information, go to Create a scatterplot with a regression fit line.
With Regression and Groups
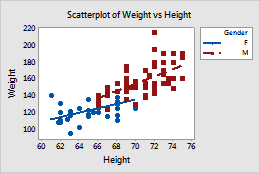
Create a scatterplot that displays the data values for pairs of variables at their (x, y) coordinates, divided into groups. Include a regression fit line for each group. Groups are represented by different colors and symbols. For example, the following scatterplot shows the relationship between weight and height for each gender, with regression fit lines that represent the relationships.
For more information, go to Create a scatterplot with regression fit lines and groups.
With Connect Line
Create a scatterplot that displays the data values for a pair of variables at their (x, y) coordinates, connected with a line. A scatterplot with a connect line can show how data values change over time. For example, the following scatterplot shows the winning times for a 100m race by year, with a connect line.
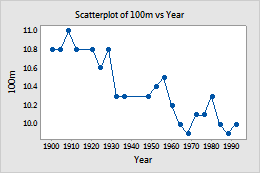
For more information, go to Create a scatterplot with a connect line.
With Connect and Groups
Create a scatterplot that displays the data values for pairs of variables at their (x, y) coordinates, divided into groups. Include a connect line for each group. Groups are represented by different colors and symbols. A scatterplot with connect lines can show how data values change over time. For example, the following scatterplot shows the relationship between the winning times for a 100m race and a 200m race by year, with connect lines.
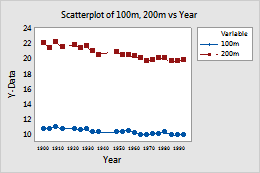
For more information, go to Create a scatterplot with connect lines and groups.