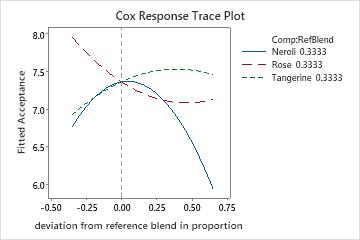
Use Response Trace Plot, also known as a component effects plot, to examine the effect of each component on the response. The trace curves show the effect of changing the corresponding component along an imaginary line (direction) connecting the reference blend to a vertex.
Response trace plots are especially useful when there are more than three components in the mixture and you cannot display the complete response surface on a contour plot or surface plot. You can use the response trace plot to identify the most influential components and then plot them on a contour or surface plot.
For example, a researcher creates a mixture design to study how the proportions of three ingredients in a household deodorizer affect the acceptance of the product based on scent. The three components are neroli oil, rose oil, and tangerine oil. To help visualize the component effects, the researcher creates a response trace plot.
Response trace plots use the most recent model that you fit for a response. If you did not perform Analyze Mixture Design, you do not have a model to use.
Where to find this plot
To create a response trace plot, choose
When to use an alternate analysis
- If you have fit a model and want to display the response surface, you can use Contour Plot or Surface Plot.
- If you have fit at least one model and want to identify an area where the predicted means of one or more response variables are in an acceptable range, use Overlaid Contour Plot.
- If you have fit at least one model and want to find values that optimize one or more responses, use Response Optimizer.