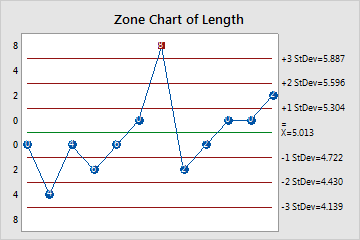
Use Zone Chart to monitor the mean of your process with a control chart that uses sigma intervals (zones) and a cumulative scoring system instead of tests for special causes to detect out-of-control points. You can plot data in subgroups or individual observations.

The zone scores are added for consecutive points to calculate the cumulative score, and each point is labeled with its cumulative score. Subgroup 6 has a cumulative score of zero. Subgroup 7 has a zone score of 8, indicating an out-of-control point.
Where to find this control chart
To create a Zone chart, choose .
When to use an alternate control chart
If you want a chart that uses tests for special causes to detect out-of-control points, create a Xbar-R Chart when you have subgroups or an I-MR Chart when you have individual data.
