Use Moving Average
Chart to monitor the unweighted moving averages when you want to detect small shifts in the process mean. The observations can be individual measurements or subgroup means. Use this control chart to monitor process stability over time so that you can identify and correct instabilities in a process.
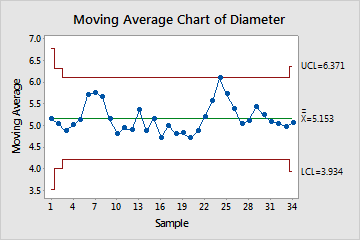
For example, a manufacturer of plastic pipes wants to monitor small shifts in the diameter of the pipes. The manufacturer collects a subgroup of 3 pipes every hour for 35 hours.
The points vary randomly around the center line and are within the control limits. No trends or patterns are present. The diameter of plastic pipes is stable across the 35 subgroups.
Where to find this control chart
To create a moving average chart, choose Stat > Control Charts > Time-Weighted Charts > Moving Average.
When to use an alternate control chart
The EWMA chart is generally preferred over the Moving Average chart because the EWMA chart weights the observations and each plotted point on the EWMA chart takes all of the previous observations into account.
If you do not want to detect small shifts in a process, use a variables chart for subgroups, such as Xbar-R Chart, or an variables chart for individuals, such as I-MR Chart.
If your data are counts of defectives or defects, use an attribute control chart, such as P Chart or U Chart.