Researchers in a food laboratory want to enhance a recipe for cheese fondue by improving the flavor, maximizing the amount that sticks to bread dipped into the fondue, and minimizing the amount that is burned at the bottom of the pot. The researchers design an extreme vertices mixture experiment to study the effects of the mixture blend and serving temperature.
- Open the sample data, FondueRecipe.MWX.
- Choose .
- In Responses, enter Flavor.
- Under Type of Model, select Mixture components and process variables.
- Under Analyze Components in, select Proportions.
- Under Model Fitting Method, select Mixture regression.
- Click Terms.
- Use the arrows to move the following terms to Selected Terms: Emmenthaler, Gruyere, Broth, AB, BC, A*X1, B*X1, C*X1.
- Click OK and then click Graphs.
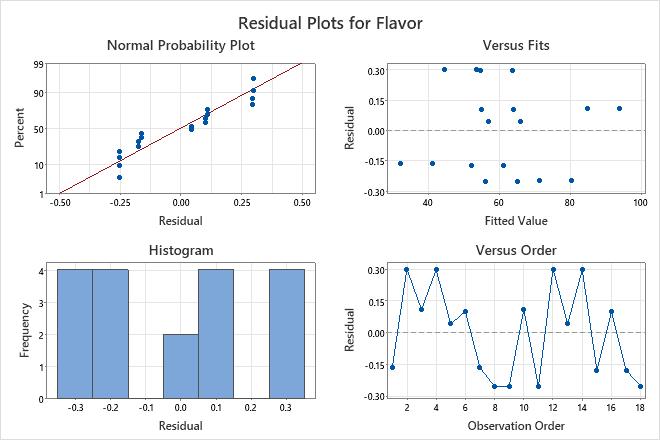
- Under Residual Plots, select Four in one.
- Click OK in each dialog box.
Interpret the results
Because the p-values are less than the significance level of 0.05, the researchers conclude that the interaction effects are statistically significant.
The positive coefficients for the interaction terms with two components indicate that the two component blends act synergistically. That is, the mean flavor score for the blend is greater than you would obtain by calculating the simple mean of the two flavor scores for each pure mixture.
Additionally, the interaction between the ingredients and the process variable, temperature, indicate that the flavor score of the blends differs depending on the serving temperature.
The R2 value shows that the model explains 99.98% of the variation in flavor, which indicates that the model fits the data extremely well.
Tip
To further explore the relationships of the components and the process variables with the response, use Contour Plot, Surface Plot and Response Trace Plot.
Estimated Regression Coefficients for Flavor (component proportions)
| Term | Coef | SE Coef | T-Value | P-Value | VIF |
|---|---|---|---|---|---|
| Emmenthaler | 104.874 | 0.667 | * | * | 15.94 |
| Gruyere | 175.08 | 5.89 | * | * | 203.46 |
| Broth | -8.810 | 0.659 | * | * | 26.04 |
| Emmenthaler*Gruyere | 59.2 | 10.3 | 5.75 | 0.000 | 57.33 |
| Gruyere*Broth | 30.04 | 9.00 | 3.34 | 0.008 | 109.44 |
| Emmenthaler*Temperature | 4.500 | 0.475 | 9.48 | 0.000 | 8.09 |
| Gruyere*Temperature | 4.500 | 0.679 | 6.62 | 0.000 | 2.71 |
| Broth*Temperature | 4.500 | 0.443 | 10.16 | 0.000 | 11.76 |
Model Summary
| S | R-sq | R-sq(adj) | PRESS | R-sq(pred) |
|---|---|---|---|---|
| 0.276960 | 99.98% | 99.97% | 2.65322 | 99.93% |
Analysis of Variance for Flavor (component proportions)
| Source | DF | Seq SS | Adj SS | Adj MS | F-Value | P-Value |
|---|---|---|---|---|---|---|
| Regression | 7 | 3924.18 | 3924.18 | 560.597 | 7308.30 | 0.000 |
| Component Only | ||||||
| Linear | 2 | 3557.10 | 741.33 | 370.664 | 4832.22 | 0.000 |
| Quadratic | 2 | 2.58 | 2.58 | 1.289 | 16.80 | 0.001 |
| Emmenthaler*Gruyere | 1 | 1.72 | 2.53 | 2.532 | 33.01 | 0.000 |
| Gruyere*Broth | 1 | 0.85 | 0.85 | 0.855 | 11.14 | 0.008 |
| Component * Temperature | ||||||
| Linear | 3 | 364.50 | 364.50 | 121.500 | 1583.95 | 0.000 |
| Emmenthaler*Temperature | 1 | 335.51 | 6.89 | 6.887 | 89.79 | 0.000 |
| Gruyere*Temperature | 1 | 21.07 | 3.37 | 3.365 | 43.87 | 0.000 |
| Broth*Temperature | 1 | 7.92 | 7.92 | 7.924 | 103.30 | 0.000 |
| Residual Error | 10 | 0.77 | 0.77 | 0.077 | ||
| Total | 17 | 3924.94 |