Use Zone Chart to monitor the mean of your process with a control chart that uses sigma intervals (zones) and a cumulative scoring system instead of tests for special causes to detect out-of-control points. You can plot data in subgroups or individual observations.
For example, a manufacturer wants to assess the length of a part. The quality team samples 10 parts from each of 3 shifts for 4 days.
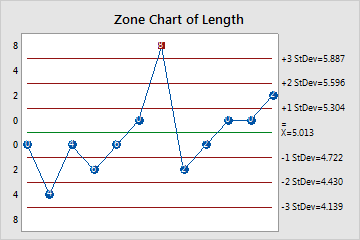
The zone scores are added for consecutive points to calculate the cumulative score, and each point is labeled with its cumulative score. Subgroup 6 has a cumulative score of zero. Subgroup 7 has a zone score of 8, indicating an out-of-control point.
Where to find this control chart
To create a Zone chart, choose Stat > Control Charts > Variables Charts for Subgroups > Zone.
When to use an alternate control chart
If you want a chart that uses tests for special causes to detect out-of-control points, create a Xbar-R Chart when you have subgroups or an I-MR Chart when you have individual data.