Select the method or formula of your choice.
In This Topic
Methods and formulas for MEWMA statistic for Multivariate EWMA chart

where:
Zi, the MEWMA vector, represents the weighting of previous subgroups.
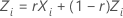
where:
Xi, the subgroup mean vector, =

 = the weighted covariance matrix
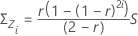
where:
S is the sample covariance matrix. For more information on calculating the S matrix, go to Tsquared plotted point.
Notation
| Term | Description |
|---|---|
| n | subgroup size |
| S | sample covariance matrix. For more information on calculating the S matrix, see T-squared statistic |
Methods and formulas for control limits for Multivariate EWMA chart
The program used to calculate the upper control limit for the MEWMA chart is described in Bodden et al.1
Methods and formulas for Box-Cox
Box-Cox formula
If you use a Box-Cox transformation, Minitab transforms the original data values (Yi) according to the following formula:
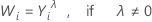
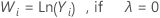
where λ is the parameter for the transformation. Minitab then creates a control chart of the transformed data values (Wi). To learn how Minitab chooses the optimal value for λ, go to Methods and formulas for Box-Cox Transformation.
Common λ values
| λ | Transformation |
|---|---|
| 2 |  |
| 0.5 |  |
| 0 |  |
| −0.5 |  |
| −1 |  |