Select the method or formula of your choice.
Plotted points
Center line and control limits
Center line (CL)
The center line is the 50th percentile of the distribution.
Lower control limit (LCL)

Upper control limit (UCL)

Notation
| Term | Description |
|---|---|
| Φ | cumulative distribution function of the standard normal distribution |
| INV | inverse cumulative distribution function |
| Kz | distance from the center line expressed in units of the standard deviation of a normal distribution; the value used for Test 1 |
Estimating the distribution parameters
The T chart analyzes the durations between subsequent events. If the data are entered as dates or times of events, then Minitab first converts the data to number of days between subsequent events. If all durations are greater than zero, then Minitab estimates the distribution parameters using the maximum likelihood method described in Parametric Distribution Analysis.
If one or more durations = 0
A duration of zero indicates that two events occurred simultaneously. If one or more durations is equal to zero, then Minitab uses an alternative method to estimate the parameters.
Let yi = the duration (in days) between event i and event i – 1. Let xi be defined as follows:
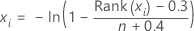
where Rank(xi) is the rank, from smallest to largest, of xi in x.
For each yi = 0, exclude yi and xi from the remaining calculations.
Weibull
To estimate the parameters for the Weibull distribution, first transform both y and x by taking the natural log of each. Then use simple linear regression to fit the model y = β0 + β1x. The scale for the Weibull distribution is estimated as exp(β0) and the shape is estimated as 1 / β1.
Exponential
The scale for the exponential distribution is estimated as the regression coefficient, β1, in the simple linear regression equation, y = β1x. Note that the intercept (β0) is not fit in this model.