Time Interval Results
Time Interval Results allow you to measure your KPIs at specific time intervals, so that you can see a snapshot of your results at any point in the simulation run. This can be useful in scenarios such as analyzing the different throughput levels of a production line each day, understanding what hours of the day patients are waiting longest in an Emergency Department, looking at call handling staff utilization in an office, or analyzing the number of customers in a store throughout each day.
It is ideal in helping you understand how your system performs over intervals, as the effect of poor performance over a certain interval can be hidden in the average result.
Setting Up Time Interval Results
- Enable the Time Series Results collection.
- Add your KPIs.
- Set the time interval.
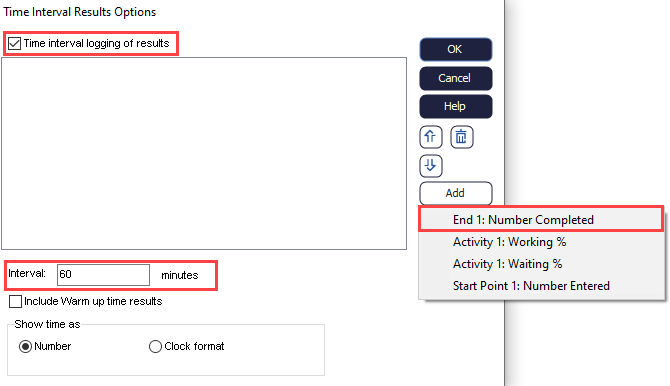
If you have a warm up time in your simulation, you can choose to include this as part of your Time Interval Results. You will then be able to access your results by a generated spreadsheet named Time Interval Results.
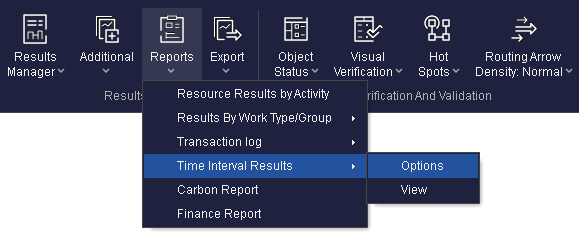
Accessing the Time Interval Results for Analysis
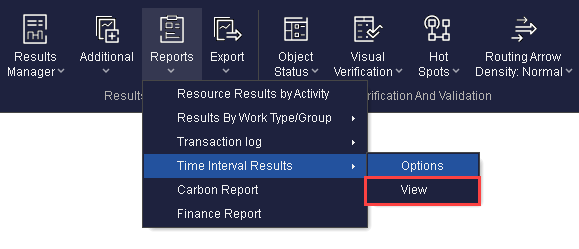
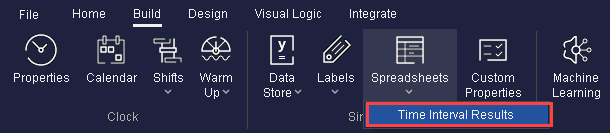
Or, access the spreadsheet by navigating to Build > Spreadsheets Dropdown > Time Interval Results.
Note
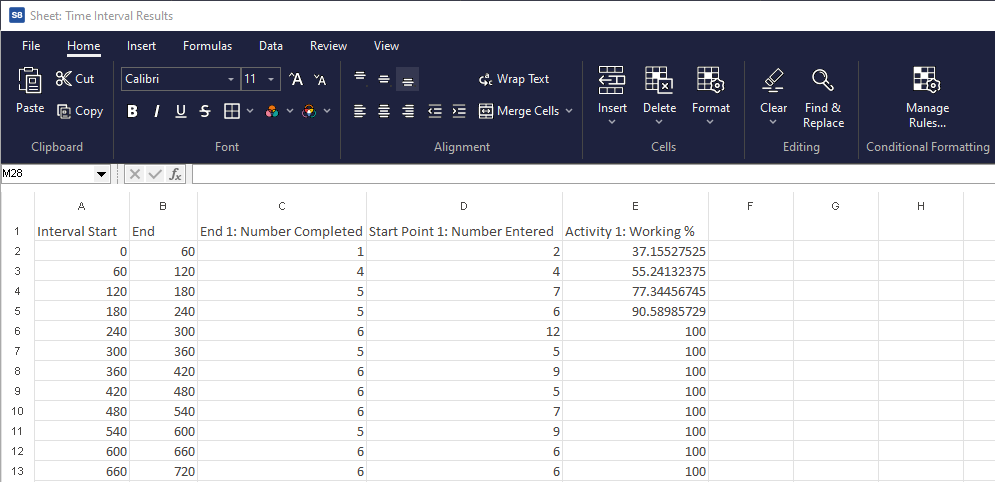
The results presented are the results for that specific interval, and are not cumulative. Below is an example spreadsheet produced by the Time Interval Results feature.