Charts from Spreadsheets
With Simul8 you can create your own charts that are displayed in floating windows or can be pinned to the main simulation window or any sub-window. These charts are completely customizable and can display a fixed variable or calculation value over time.
You can also create a customizable chart of the data you have stored in an internal spreadsheet.
Creating Charts of your Spreadsheet Data
- Create a spreadsheet and populate it with data, or write Visual Logic to update the values at run time.
- Select the Insert tab on the Ribbon, click Charts and click New to create a new chart.
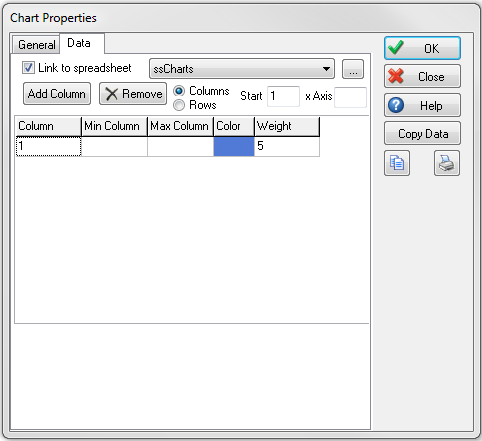
- Select the Data tab and check the Link to Spreadsheet check box.
- Select the name of your spreadsheet from the drop down list.
- Click the Add Column button, a row will be added in the table below. Enter the column number in the spreadsheet that holds the data you wish to plot.
- Continue using the Add Column button until you have added all the columns of data you wish to plot, each will be displayed as a separate series on the chart.
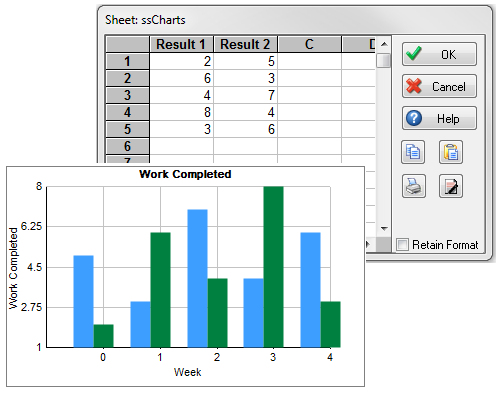
- Select either Column or Rows from the radio button to specify whether you wish the spreadsheet data to be read by the chart from top to bottom (Column) or left to right (Row).
- In the Start box enter the row or column number where Simul8 should begin reading the data from. If you have selected Column enter the row where data starts.
- To specify your own x axis values enter the column or row number that holds your axis values. If the value is left at zero then Simul8 will use simulation time for the x axis by default.
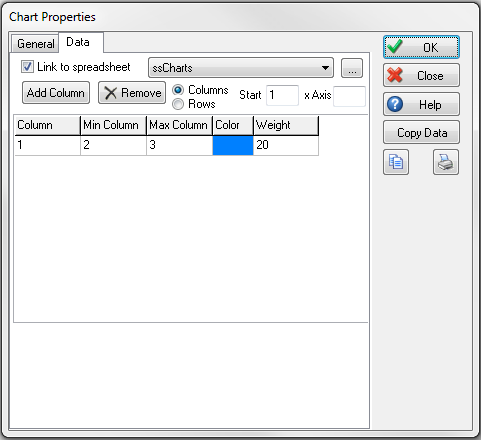
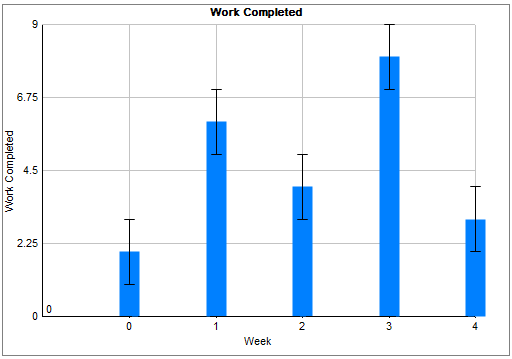
- Include Error bars on your charts by entering the column or row numbers into the Min Column and Max Column. This is particularly useful for displaying confidence intervals on your charts.
Visual Logic Commands to Control Chart Updates
By default Simul8 will redraw your chart every 5 simulation time units, or whatever time value is specified in the Results Synchronization Interval. But if you know your spreadsheet data will not change as frequently as that you can control when your charts are updated through Visual Logic to optimize the speed of your simulation.
To manually control when your charts are updated in your On Reset Visual Logic, use the Set Chart To Auto Update (for individual charts) or Set All Charts To Auto Update (for all charts), to prevent Simul8 from redrawing your charts unless you tell it to.
Then at the appropriate point in your run time Visual Logic code, for example in your Time Check Logic or in the On Exit code of your Activity you tell Simul8 to redraw your chart. Use the Refresh Chart command to redraw the chart from the last point plotted. Use the Rebuild Chart command to erase all data points previously plotted and completely redraw the chart.