Charts on Spreadsheets
With Simul8's internal spreadsheets, you can add a chart to display your data, directly onto the sheet. This can help visualize results for stakeholders.
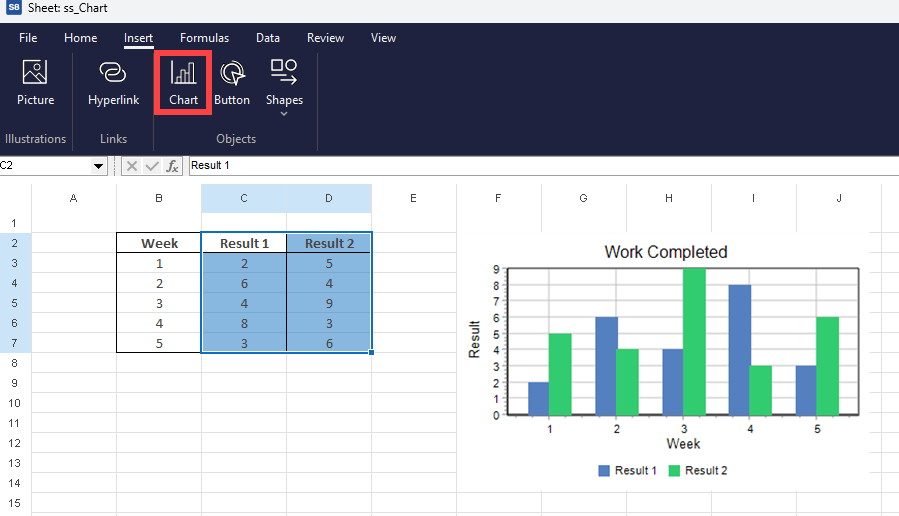
First, highlight the data, then click on 'Chart' in the insert tab. Simul8 will create the chart for you.
Editing a Chart
To edit a chart, select it to open the Chart Detail tab where you can access the following options:
Chart Type
- Choose the type of chart - options include Bar, Line, Point, Area and Pie
- Adjustments - Stacked and Show Points
Edit Layout
- Titles - Chart and axes titles
- Axes - Number Format, decimals and other options
- Legend - Toggle on/off, title and location
- Background - Color and gridlines
Edit Data
- Add / Remove series
- Edit the series Range, Name and Color
All these editing dialogs have a preview in the bottom right corner. Click on the preview to enlarge it. Click again to close it.