In This Topic
Enter your data
In Variable, enter a column of numeric data that were collected at regular intervals and recorded in time order. If your data are in multiple columns (for example, you have data for each year in a separate column), you must stack the data into a single column.
In this worksheet, Sales contains the number of computers that are sold each month.
| C1 |
|---|
| Sales |
| 195000 |
| 213330 |
| 208005 |
| 249000 |
| 237040 |
Model Type
- Graph the data using Time Series Plot. Then, compare your plot to the following figures to determine the correct type of model.
- You can fit the four models and compare the measures of accuracy (MAPE, MAD, and MSD). Choose the model with the smallest accuracy measures.
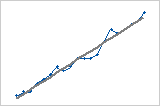
- Linear
-
The data fits a line, which indicates that the rate of change is uniform over time. The model is Yt = β0 + (β1 * t) + et. In this model, β1 represents the average change from one period to the next.
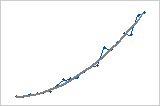
- Quadratic
-
The data have a curvature, which indicates that the rate of change varies over time. The model is Yt = β0+ β1 * t + (β2* t2) + et.
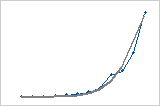
- Exponential growth
-
The data have a steep curvature, which indicates that the rate of change varies more quickly over time. For example, a savings account might exhibit exponential growth. The model is Yt = β0 * β1t * et.
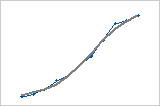
- S-Curve (Pearl-Reed logistic)
-
The data has an S-shape, which indicates that the direction of the change varies over time. The model is Yt = (10a) / (β0 + β1 * β2t).
Generate forecasts
Complete the following steps to generate forecasts for your time series.
- Select Generate forecasts.
- In Number of forecasts, enter the number of consecutive time periods that you want forecasts for.
- In Starting from
origin, specify the row number for the first forecast. If you leave this field blank, Minitab starts the forecasts at the end of the time series.
If you enter a value, Minitab uses only the data up to that row number for the forecasts. The forecast values differ from the fits because Minitab uses all of the data to calculate the fits.
For example, an analyst has monthly data for January through December. In December, the analyst wants to generate a forecast for the next month, but December's data are incomplete. In Number of forecasts, the analyst enters 2. In Starting from origin, the analyst enters 12. Minitab uses the data through November to generate forecasts for December and January.