In This Topic
Reference
The reference, Xm, serves as a point of comparison in a study. Usually, a reference value is determined by averaging multiple measurements of the reference part that are taken with lab-calibrated measuring equipment.
Ideally, Xm is close to the center of the tolerance zone for the characteristic that you measure.
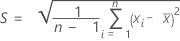
Mean
The mean of the measurements of a part is calculated by:

Notation
| Term | Description |
|---|---|
| Xi | the measurement of the ith part |
| n | the number of measurements |
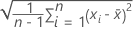
Standard deviation
The standard deviation of the measurements of a part is calculated by:
Notation
| Term | Description |
|---|---|
 | the mean of n measurements |
| Xi | the measurement of the ith part |
| n | the number of measurements |
Study variation (SV)
The study variation is calculated by:

Notation
| Term | Description |
|---|---|
| k1 | Minitab uses the default value of 6 standard deviations from a standard normal distribution to represent 99.73% of your measurements. To change this value, see the Options sudialog box. For example, use the multiplier 5.15 to represent 99% of your measurements. |
| S | the standard deviation of the measurements |
Tolerance
The tolerance is specified for each component. You must enter either the tolerance or one of the specification limits.
Tolerance = USL – LSL or USL – 0 when the LSL is replaced by the natural zero.
Notation
| Term | Description |
|---|---|
| USL | the upper specification limit |
| LSL | the lower specification limit |
Resolution
The resolution is the specified gage resolution.
A guideline for the resolution is that it should not be greater than 5% of the tolerance. So, if you specify both the resolution and the tolerance, Minitab calculates whether the resolution is less than, greater than, or equal to 5% of the tolerance.
Bias
The gage bias is calculated by the difference between the mean of the n measurements and the reference value.

Notation
| Term | Description |
|---|---|
 | the mean of n measurements |
| Xm | the reference measurement |
T
The t-statistic for testing the null hypothesis that bias = 0 versus the alternative hypothesis that bias ≠ 0.
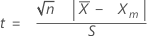
t follows the t-distribution with γ degrees of freedom, where γ = n – 1.
Notation
| Term | Description |
|---|---|
| n | the number of measurements |
 | the mean of n measurements |
| Xm | the reference measurement |
| S | the standard deviation of the measurements |
p-value
The p-value is associated with the t-statistic. It is the probability of obtaining a t-statistic as large or larger than the calculated one, assuming that the bias is zero. As the t-statistic increases, the p-value decreases. The smaller the p-value, the greater the evidence against the null hypothesis that the bias = 0.
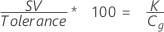
Cg
Capability indices are calculated only when the gage tolerance is specified. The capability of the gage is calculated by:
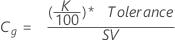
Notation
| Term | Description |
|---|---|
| K | the percent of the tolerance for calculating Cg specified in the Options subdialog box, default = 20 |
| SV | the study variation |
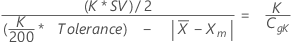
CgK
Capability indices are calculated only when the gage tolerance is specified. The capability of the gage, considering both the gage variation and the bias, is calculated by:
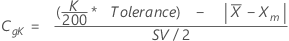
Notation
| Term | Description |
|---|---|
| K | the percent of the tolerance for calculating Cg specified in the Options subdialog box, default = 20 |
 | the mean of n measurements |
| Xm | the reference measurement |
| SV | the study variation |
%Var (Repeatability)
% Var for repeatability compares the gage repeatability with the tolerance. % Var is calculated by dividing the study variation by the tolerance and multiplying by 100.
Notation
| Term | Description |
|---|---|
| K | the percent of the tolerance for calculating Cg specified in the Options subdialog box, default = 20 |
| SV | the study variation |
%Var (Repeatability and Bias)
% Var for repeatability and bias compares the gage repeatability and bias with the tolerance.
Notation
| Term | Description |
|---|---|
| K | the percent of the tolerance for calculating Cg specified in the Options subdialog box, default = 20 |
 | the mean of n measurements |
| Xm | the reference measurement |
| SV | the study variation |
Statistics for VDA 5
Note
VDA 5 is in the web app only.
- Repeatability at reference (uEVR)
-
- Resolution (uRE)
-

- Bias (uBI)
-

- Other factors (uREST)
-
- Measurement System (uMS)
-

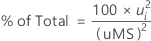
% of Total
%QMS

Notation
| Term | Description |
|---|---|
| n | the number of measurements |
| xi | the measurement of the ith part |
 | the mean of n measurements |
| RE | The resolution of the measurement system. The calculations include the uncertainty due to resolution if the specifications for the analysis include the resolution. |
| xm | the reference measurement |
| uCAL | The uncertainty due to calibration. The value is 0 unless the specifications for the analysis include the value. |
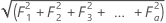
| Fi | The uncertainty due to additional factors. The values are from specifications for the analysis. |
| a | the number of other factors that contribute to uncertainty in the specifications for the analysis |
| uLIN | The uncertainty due to linearity. The value is 0 unless the specifications for the analysis include the value. |
| ui | a single component of uncertainty |
| k1 | Minitab uses the default value of 6 standard deviations from a standard normal distribution to represent 99.73% of your measurements. To change this value, see the Options subdialog box. For example, use the multiplier 5.15 to represent 99% of your measurements. |