In This Topic
Run chart
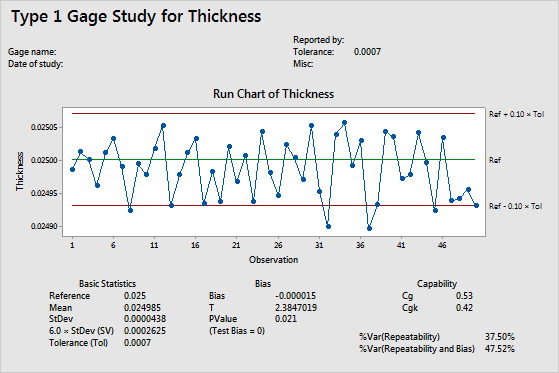
The run chart shows how the measurements vary with respect to the reference value and the tolerance range. The observations are plotted in measurement sequence. Use a run chart to look for evidence of bias or other measurement system variation in your process.
Reference
The reference value is the known and correct measurement for the standard part. It serves as a master value for comparison during measurement system analysis. For example, you have a reference part with a known weight of 0.025g that you use to calibrate your scales.
Ideally, the reference value should be close to the center of the tolerance zone for the characteristic that you measure.
Reference values can be determined in many ways, depending on industry standards and company and customer expectations. Usually a reference value is determined by taking an average of repeated measurements from more accurate measuring equipment, or by using a lab-certified standard.
Mean
The mean is the average of all the measurements of the standard, which is the sum of all the measurements divided by the number of measurements.
StDev
StDev is the standard deviation of all the measurements of the standard.
The standard deviation is the most common measure of dispersion, or how spread out the data are from the mean. A larger sample standard deviation indicates that your data are spread more widely around the mean.
6 * StDev(SV)
The study variation is 6 times the standard deviation.
By default, the study variation for each component is six times its standard deviation, but you can change the multiplier. AIAG recommends the use of 6 in gage R&R studies because 6 is the number of standard deviations needed to capture 99.73% of the variation from a source. For instance, specify 5.15 to capture 99% of the variation.
Tolerance (Tol)
The tolerance is the tolerance range of the measured component. It is the difference between the upper and lower specification limits.
Bias
The bias is a measure of a measurement system's accuracy. Bias is calculated as the difference between the known standard value of a reference part and the observed average measurement.
Interpretation
- A positive bias indicates that the gage measures high.
- A negative bias indicates that the gage measures low.
For a gage that measures accurately, the %bias will be small. To determine whether the bias is statistically significant, use the p-value.
T
T is the t-statistic for the alternative hypothesis that bias ≠ 0.
The t-test compares this observed t-statistic to a critical value on the t-distribution with (n-1) degrees of freedom to determine whether the bias in the measurement system is statistically significant.
p-value
The p-value is associated with the t-statistic. It is the probability of obtaining a t-statistic as large or larger than the calculated one, assuming that the bias is zero. As the t-statistic increases, the p-value decreases. A small p-value implies that the assumption that the bias = 0 is probably not true.
Cg
Cg is a capability index that compares the tolerance range with the measurement variation from the gage and the operator.
Interpretation
Larger values of Cg indicate a more capable system. When Cg is less than the commonly used benchmark value of 1.33, the measurement system cannot measure parts consistently and accurately.
Capability indices are calculated only when the tolerance range is specified.
For more information on Cg, go to Minitab measures repeatability with the Cg metric.
CgK
CgK is a capability index that compares the tolerance range with the total of the bias and the measurement variation from the gage and the operator.
Interpretation
Larger values of Cgk indicate a more capable system. When Cgk is less than the commonly used benchmark value of 1.33, the measurement system cannot measure parts consistently and accurately.
Capability indices are calculated only when the tolerance range is specified.
For more information on Cgk, go to Minitab measures bias with the Cgk metric.
Resolution
The resolution is the specified gage resolution.
A guideline for the resolution is that it should not be greater than 5% of the tolerance. So, if you specify both the resolution and the tolerance, Minitab calculates whether the resolution is less than, greater than, or equal to 5% of the tolerance.
%Var (Repeatability)
%Var for repeatability compares the gage repeatability with the tolerance.
%Var (Repeatability and Bias)
%Var for repeatability and bias compares the gage repeatability and bias with the tolerance.
VDA 5
- Calibration (uCAL)
- Calibration (uCAL) is the uncertainty in the measurements from the calibration of the reference standard. This statistic is an input to the analysis. Usually, this value comes from the calibration certificate.
- Repeatability at reference (uEVR)
- Repeatability at reference (uEVR) is the uncertainty from repeat measurements of the reference part by the same operator with the same device.
- Resolution (uRE)
- Resolution (uRE) is the uncertainty due to the resolution of the gauge. The analysis calculates this statistic when the resolution of the gauge is an input to the analysis.
- Bias (uBI)
- Bias (uBI) is the uncertainty in the measurements due to the difference from the known reference measurement and the average of the measurements in the study.
- Linearity (uLIN)
- Linearity (uLIN) is the uncertainty in the measurements from linearity. Linearity is the difference between the value of the reference part and the average measurement that comes from the change in the bias as the value of the part changes. This statistic is an input to the analysis. Usually, this value comes from a linearity study where the reference part was within the range of measurements.
- Other factors (uREST)
- Other factors (uREST) is the uncertainty in the measurements due to one or more additional factors. If the specifications for the analysis have one additional factor, then this uncertainty is an input to the analysis. If the specifications for the analysis have more than one factor, then this uncertainty combines the values. For example, use the specifications for other factors to account for uncertainty due to temperature if the measurements have wider differences when the data collection is at a higher temperature.
- Measurement system (uMS)
- Measurement system (uMS) combines all the uncertainty components to estimate the total uncertainty from the measurement system.
- % of Total
- For each source of uncertainty, the analysis presents the percentage of the uMS that results from that source. Use the percentage to compare the amount of uncertainty from the different sources.
- % of tolerance (%QMS)
- % of tolerance (%QMS) combines the uncertainty of the measurement system with the study variation and compares the value to the process tolerance. %QMS is a common way to decide if a measurement system is satisfactory. In some applications, a value of 15% or less indicates that a measurement system is satisfactory.