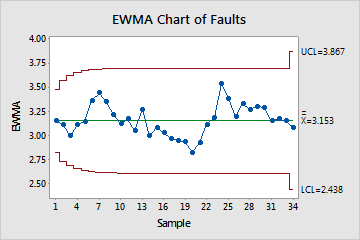
Use EWMA Chart to detect small shifts in the process mean, without influence by low and high values. The EWMA chart monitors exponentially weighted moving averages, which remove the influence of low and high values. The observations can be individual measurements or subgroup means. An advantage of EWMA charts is that they are not greatly influenced by low or high values.

The points appear to vary randomly around the center line and are within the control limits. No trends or patterns are shown. The variability in the rotor diameter appears stable.
Where to find this control chart
To create an EWMA chart, choose .
When to use an alternate control chart
-
If you do not want to detect small shifts in a process, use a variables chart for subgroups, such as Xbar-R Chart, or an variables chart for individuals, such as I-MR Chart.
- If your data are counts of defectives or defects, use an attribute control chart, such as P Chart or U Chart.
