Use T²-Generalized Variance
Chart to simultaneously monitor whether the process location and the process variability of two or more related variables are in control. This chart is the multivariate counterpart to the Xbar-R, Xbar-S, and I-MR charts.
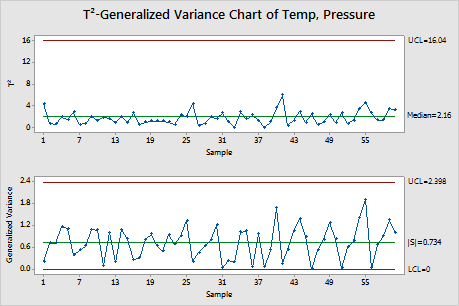
For example, an engineer uses a T2-generalized variance chart to monitor temperature and pressure in a plastic injection-molding process. Because temperature and pressure both affect the plastic strength, the engineer wants to monitor these variables at the same time.
The points vary randomly around the center line and are below the upper control limit for both charts. No trends or patterns are shown. The process location and process variability of the plastic product strength are stable.
Where to find this control chart
To create a T2-generalized variance chart, choose Stat > Control Charts > Multivariate Charts > T²-Generalized Variance.