Use an Acceptance Xbar Chart to detect when the out-of-specification percentage might exceed an acceptable level.
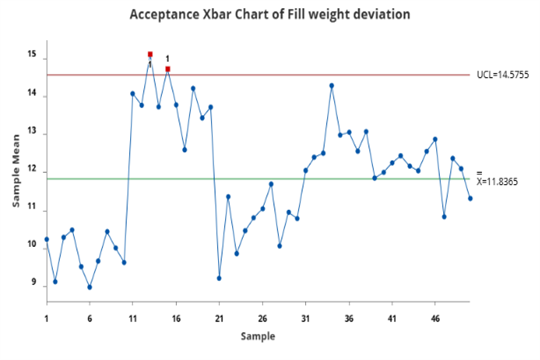
Two subgroup means during the first upward shift are above the upper acceptance control limit. These points indicate that the process mean shifted far enough toward the upper specification limit that more than 1% of the process output might exceed the specification limit.
Note
The process variation must be in control before you assess the process center using an Acceptance Xbar chart because the acceptance control limits are calculated using the within-subgroup variation. If the process variation is not in control, the acceptance control limits are not reliable and Minitab might produce a false out-of-control signal. Use an R chart or S chart to assess whether the process variation is in control.
Where to find this control chart
To create an Acceptance Xbar chart, choose .
When to use an alternate control chart
- If you do not have subgroups, use Acceptance Individuals Chart.
