Use an Acceptance I-MR Chart to detect when the out-of-specification percentage might exceed an acceptable level, and to monitor the variation using moving ranges. Use when you have continuous data that are individual observations not in subgroups.
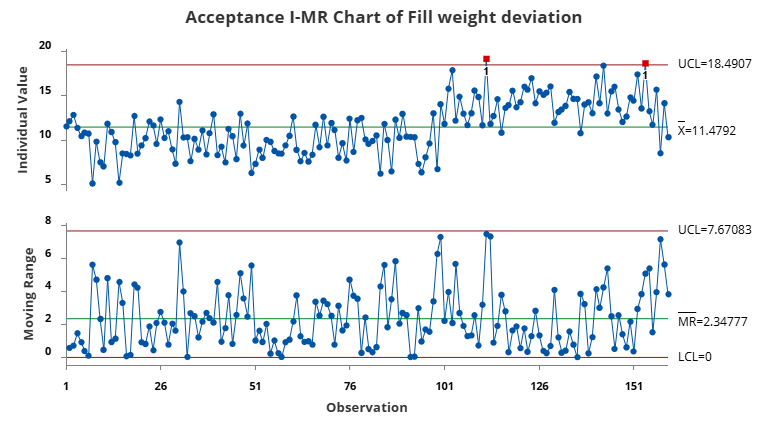
The MR chart does not show evidence of unusual variation, so the engineer can interpret the Acceptance I chart. Two observations are above the upper acceptance control limit. These points indicate that the process shifted far enough toward the upper specification limit that more than 1% of the process output might exceed the specification limit.
Where to find this control chart
To create an Acceptance I-MR chart, choose .
When to use an alternate control chart
- If you can collect data in subgroups, use Acceptance Xbar-R Chart or Acceptance Xbar-S Chart.
