Use CUSUM Chart to detect small shifts in your process. The CUSUM chart plots the cumulative sums (CUSUMs) of the deviations of each sample value from the target value. Because the CUSUM chart is cumulative, even minor drifting in the process mean will cause steadily increasing (or decreasing) cumulative deviation values. The observations can be individual measurements or subgroup means.
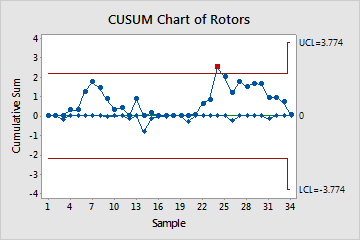
The points appear to vary randomly around the center line and are within the control limits, with the exception of one point. No trends or patterns are shown. The variability in the rotor diameter appears to be stable, but the out-of-control point should be investigated.
Where to find this control chart
To create a CUSUM chart, choose .
When to use an alternate control chart
-
If you do not want to detect small shifts in a process, use a variables chart for subgroups, such as Xbar-R Chart, or an variables chart for individuals, such as I-MR Chart.
- If you want to detect small shifts in a process but want to use a more traditional control chart, use an EWMA Chart.
- If your data are counts of defectives or defects, use an attribute control chart, such as P Chart or U Chart.