Use Xbar-S Chart to monitor the mean and variation of a process when you have continuous data and subgroup sizes of 9 or more. Use this control chart to monitor process stability over time so that you can identify and correct instabilities in a process.
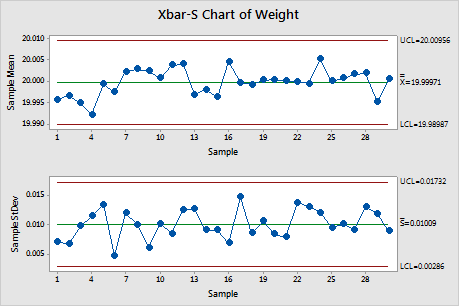
For example, a paint manufacturer wants to assess the stability of its filling process for cans of paints. Operators collect subgroups of 10 cans every hour for 30 hours and use an Xbar-S chart to monitor the mean and variation of the filled paint cans.
The points vary randomly around the center line and are within the control limits. No trends or patterns are present. The mean and variation of the weights of cans are stable across the 30 subgroups.
Where to find this control chart
To create an Xbar-S chart, choose Stat > Control Charts > Variables Charts for Subgroups > Xbar-S.
When to use an alternate control chart
For subgroups that have 2−8 observations, use Xbar-R Chart.
If there is a consistent source of variation within the subgroups, use I-MR-R/S
Chart.