In This Topic
Carryover effect
Let C2k and C1k be defined as follows:


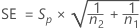
SE
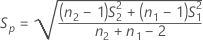
The standard error for the carryover effect is given by the following:Notation
| Term | Description |
|---|---|
 | Sample mean using the data C2k, k = 1, ..., n2 |
 | Sample mean using the data C1k, k = 1, ..., n1 |
| n2 | Number of participants in sequence 2 |
| n1 | Number of participants in sequence 1 |
| S2 | Sample standard deviation of C2k, k = 1, ..., n2 |
| S1 | Sample standard deviation of C1k, k = 1, ..., n1 |
Treatment effect
The treatment effect is given by:


SE
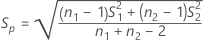
The standard error for each effect is given by the following:Notation
| Term | Description |
|---|---|
 | Sample mean for sequence i (for more information, go to Methods and formulas for common concepts used in Equivalence Test for a 2x2 Crossover Design) |
| ni | Number of participants in sequence i |
| S1 | Sample standard deviation of  for sequence i for sequence i |
Period effect
The period effect is given by:

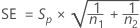

SE
The standard error for each effect is given by the following:Notation
| Term | Description |
|---|---|
 | Sample mean for sequence i (for more information, go to Methods and formulas for common concepts used in Equivalence Test for a 2x2 Crossover Design) |
| ni | Number of participants in sequence i |
| S1 | Sample standard deviation of  for sequence i for sequence i |
T-value, P-value, and confidence interval for effects
T-value
The t-value for each effect is given by the following:
P-value
The p-value for each effect is given by the following:
Confidence interval for equivalence
The confidence interval (CI) for equivalence for each effect is given by the following:
Notation
| Term | Description |
|---|---|
| SE | Standard error for the effect (for more information, see the section on each effect) |
| tα/2 | Upper α/2 critical value for a t-distribution with n1 + n2 – 2 degrees of freedom |
| α | Probability of rejecting the null hypothesis when the null hypothesis is true (also called the significance level) |
| ni | Number of participants in sequence i |