You can create a custom view of your
data so that you can focus on the fields of interest. Each data table can have multiple
views that you can save and name. These views can be used
throughout the platform for ease of data reporting and analysis. Views do not change the
actual data, but only change the presentation of the data. At any time, you can select
Reset Config
![]() to see all the data in the
table.
to see all the data in the
table.
In this example, the marketing analyst collects daily sales data. To focus on the daily breakdown of downloads by category, the marketing analyst creates a new view of the data that includes only the variables of interest.
Import data from an existing data file into a Minitab Connect table
First, the marketing analyst imports data from a Microsoft Excel (.xlsx) file into a new Minitab Connect table. After the file is imported, the data in Minitab Connect is independent of the original data file. Therefore, changes made to one source will not affect the other. Follow these instructions to create a standard table from an existing data file.
-
From the Home
 screen, select the Minitab Connect button
  to open the Navigation pane. Under Tables, select Add New Table.
Or, from the Home screen, select the Add button under Tables.
to open the Navigation pane. Under Tables, select Add New Table.
Or, from the Home screen, select the Add button under Tables.
-
On the Dataset tab, enter the following:
- Under Name, enter Online Downloads to identify the new table.
-
Under Folder, select the plus button to create a new folder.

Tip
You might find it helpful to create your own folders when saving the tables and graphs from the examples in this guide. Or you can use unique names so that the other users on your platform do not overwrite your work.
- Under Name, enter Download Data to name the folder that stores the new table.
- Under Parent, keep /(root) to create the new folder at the root level of Minitab Connect. Alternatively, you can browse to another location to create the new folder.
-
Select Save
 .
.
- Under Status, select Development.
-
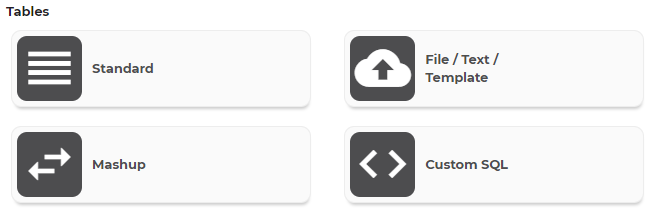
From the Tables gallery, select File / Text / Template.
- Under Import Type, select File and browse to your file. For this example, use the data set in the Minitab Data Set Library, Online Downloads Data.
-
Select Save
.
Note
Select the Notifications and Issues button ![]() to display problems with your data. For instance, you can see whether the
data have imported properly.
to display problems with your data. For instance, you can see whether the
data have imported properly.
![]()