Minitab cannot calculate the confidence interval (CI) if either of the following two conditions are not met:
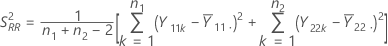
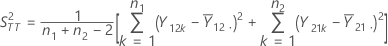
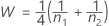
where S2RR represents the pooled variance for the reference periods, and S2TT represents the pooled variance for the test periods, and both S2RR and S2TTare calculated as described in the Pooled variance section, and W is given by the following:
By default, Minitab calculates the 100(1 - α)% CI for the ratio as follows:
CI = [min(C, ρL), max(C, ρU)]
where:
where t = t1-α,v, v = n1 + n2 – 2, and STR is calculated as described in the Pooled variance section.
100(1-2α)% CI
If you select the option to use the 100(1 – 2α)% CI, then the CI is given by the following:
CI = [ρL, ρU]
One-sided intervals
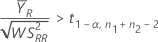
For a hypothesis of Test mean / reference mean > lower limit, the 100(1 – α)% lower bound is equal to ρL.
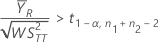
For a hypothesis of Test mean / reference mean < upper limit, the 100(1 – α)% upper bound is equal to ρU.
Notation
Term
Description
Mean of the reference periods (for more information, see the section on the Ratio)
Mean of the test periods (for more information, see the section on the Ratio)
ni
Number of participants in sequence i
v
Degrees of freedom
α
Significance level for the test (alpha)
t1-α,v
Upper 1 – α critical value for a t-distribution with v degrees of freedom
T-values
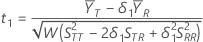
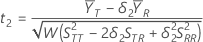
Let t1 be the t-value for the hypothesis, , and let t2 be the t-value for the hypothesis, , where is the ratio of the test mean to the reference mean for the populations. The t-values are calculated as follows:
where S2RR represents the pooled variance for the reference periods, S2TT represents the pooled variance for the test periods, and STR represents the overall standard deviation. For more information, see the section on the Pooled variance.
Notation
Term
Description
Mean of the reference periods (for more information, see the section on the Ratio)
Mean of the test periods (for more information, see the section on the Ratio)
δ1
Lower equivalence limit
δ2
Upper equivalence limit
P-values
The probability, PH0, for each null hypothesis is given by the following:
If , then:
H0
P-Value
Notation
Term
Description
Λ
Unknown ratio of the mean of the test population to the mean of the reference population
δ1
Lower equivalence limit
δ2
Upper equivalence limit
v
Degrees of freedom
T
t-distribution with v degrees of freedom
t1
t-value for the hypothesis
t2
t-value for the hypothesis
Note
For information on how the t-values are calculated, see the section on t-values.
 , divided by the reference mean,
  , as shown below:


 , and let t2 be the t-value for the hypothesis,
  , where
  is the ratio of the test mean to the reference mean for the populations. The t-values are calculated as follows:


 , then:


