- Equivalence plot
-
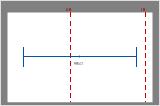
Use the equivalence plot to view a graphical summary of the equivalence test results and to determine whether you can claim equivalence.
An equivalence plot displays the equivalence limits, the confidence interval, and the decision about whether you can claim equivalence.
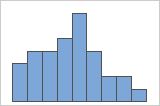
- Histogram
-
Use histograms to assess the shape and spread of the data. Histograms are best when the sample size is greater than 20.
- Individual value plot
-
Use an individual value plot to examine the spread of the data and identify any potential outliers. Individual value plots are best when the sample size is less than 50.

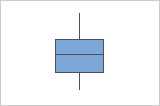
- Boxplot
-
Use a boxplot to examine the spread of the data and identify any potential outliers. Boxplots are best when the sample size is greater than 20.