Specify the percentile lines you want Minitab to display on the probability plot.
A percentile line has two segments that intersect at the fitted distribution line. One segment is drawn to intersect the data scale and the other is drawn to intersect the percent scale. Percentile lines are often used for evaluations of test scores. For example, if you want to know the test score for the 95th percentile, you can add a percentile line at 95 percent. Minitab calculates the corresponding data value. Conversely, if you add a percentile line at the data value, Minitab calculates the corresponding percent.
- None: Display no percentile line.
- At Y
values: Enter y-scale values for the percentile lines. Enter values between 0 and 100.
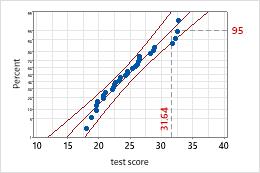
95th percentile
An employee ranking at the 95th percentile achieved a test score of 31.64. In other words, 95% of the employees had a score of 31.64 or less.
- At data
values: Enter data values for the percentile lines.
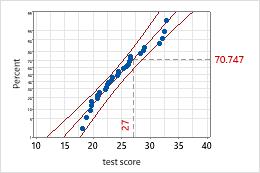
Test score of 27
A test score of 27 is slightly higher than the 70th percentile, or slightly more than 70% of the employees had a score of 27 or less.