In This Topic
Fitted value
The predicted y or  ; the mean response value for the given predictor values using the estimated regression equation.
Standard error of the marginal fitted value (SE Fit)
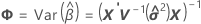
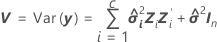
The standard error of the marginal fitted values in the mixed model depend on the test method for the fixed effects. For both methods, the standard errors are the square roots of the diagonal elements of the variance matrix of the fits.
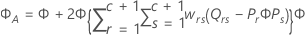
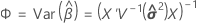
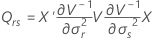
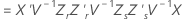
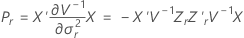
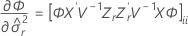
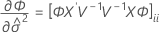
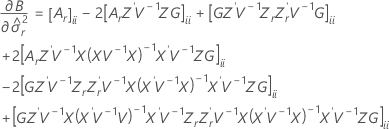
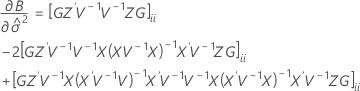
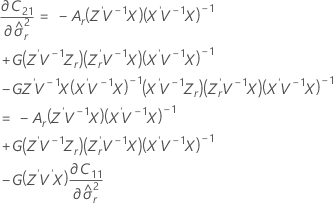
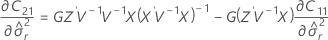
Kenward-Roger's method

where
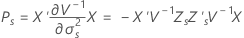
Satterthwaites approximation

where
Residuals
A residual is the difference between an observed value and a fitted value. This part of the observation is not explained by the fitted model. The residual of an observation is:

When batch is a random factor, Minitab calculates 2 types of residuals. Marginal residuals use the fitted value for a random batch, so the coefficient for batch is not in the equation.

Conditional residuals use the fitted value for a batch that is in the data.

Notation
| Term | Description |
|---|---|
| yi | ith observed response value |
 | ith fitted response value |
 | the vector of fitted responses |
| X | the design matrix for the fixed effects |
 | the vector of fixed predictors |
| Z | the design matrix for the random factors |
 | the vector of the estimated BLUP values |
Standardized residuals

where the standard deviation of the residual is the appropriate diagonal square root of the residual variance matrix:

where
Notation
| Term | Description |
|---|---|
| ei | the ith residual |
| Std(ei) | the standard deviation of the ith residual |
Confidence interval
The range in which the estimated mean response for a given set of predictor values is expected to fall.


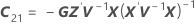
where

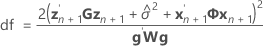
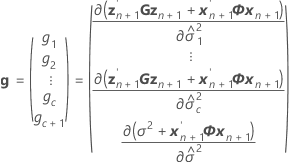
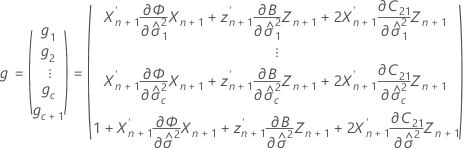
The degrees of freedom use this formula when batch is a random factor:

where


Notation
| Term | Description |
|---|---|
| t1-α/2, df | 1–α/2 quantile from the t distribution with the given degrees of freedom |
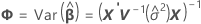
 | standard error of the fitted value |
| X | design matrix, including the constant |
| X' | transpose of X |
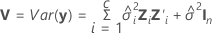
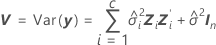
 | variance component for error |
 | variance component of the ith random factor |
| Zi | n x mi matrix of known codings for the ith random effect in the model |
| Zi' | transpose of Zi |
| In | identity matrix with n rows and columns |
| xi | predictor values for the fit or prediction |
| W | asymptotic variance-covariance matrix of the variance component for error |
| c | number of random effects in the model |
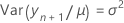
Prediction interval
The range in which the predicted response for a new observation is expected to fall. The calculation of the prediction interval depends on whether you compute the interval for the marginal fit or for the conditional fit.
Marginal fit

where


The degrees of freedom for the t-statistic are given by this formula:
where


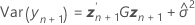
Conditional fit

where


The degrees of freedom for the t-statistic are:
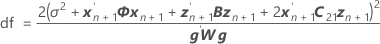
where
Notation
| Term | Description |
|---|---|
 | 1–α/2 quantile from the t distribution with the given degrees of freedom |
 | vector of the new values of the random predictors |
 | variance component for error |
 | vector of new values of the fixed predictors |
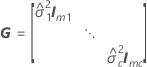
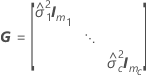
 | variance component of the ith random factor |
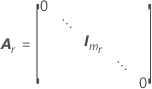
| Im | identity matrix with m rows and columns |
| m | number of columns in the design matrix to represent the ith random term in the model |
| c | number of random effects in the model |
| Zi | n x mi design matrix for the ith random effect in the model |
| Z'i | transpose of Zi |