The ROC curve plots the true positive rate (TPR), also known as power, on the y-axis. The ROC curve plots the false positive rate (FPR), also known as type 1 error, on the x-axis. The area under an ROC curve indicates whether the binary model is a good classifier.
Interpretation
The area under the ROC curve values range from 0.5 to 1. When the binary model can perfectly separate the classes, then the area under the curve is 1. When the binary model cannot separate the classes better than a random assignment, then the area under the curve is 0.5.
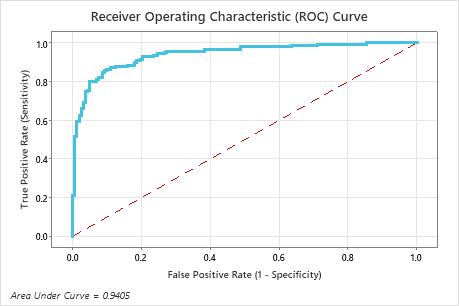
In this example, the area under the test curve is 0.9405.
With a validation method, Minitab creates two ROC curves. One curve is for the training data and the other is for the validation data. The validation results indicate whether the model can adequately predict the response values for new observations, or properly summarize the relationships between the response and the predictor variables. The training results are usually more ideal than actual and are for reference only.
A k-fold area under the ROC curve that is substantially less than the area under the ROC curve can indicate that the model is over-fit. An over-fit model occurs when the model includes terms that are not important in the population. The model becomes tailored to the training data and, therefore, might not be useful for making predictions about the population.
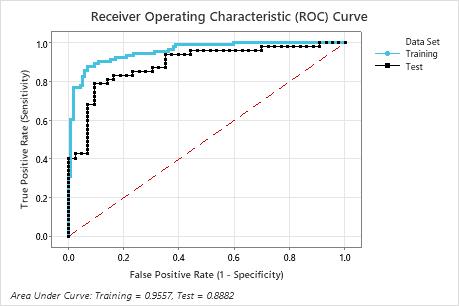
In this example, the training curve shows a better fit than the test curve. The performance of the test curve is typically a better representation of how the model performs for new data. The area under the test curve is 0.8882.