Note
This command is available with the Predictive Analytics Module. Click here for more information about how to activate the module.
y = b0 + b1BF1 + b2BF2 + ... + bkBFk
- y is the response variable
- b0 is the constant term
- b1 + b2 + ... + bk are coefficients for the basis functions
- BF1 + BF2 + ... + BFk are the basis functions
Solve the basis functions for values of the predictor to calculate the predicted value of the response.
Basis functions
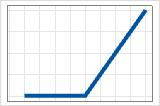
- max(0, X − c)
- Positive coefficient
- The contribution is 0 until c, then increases.
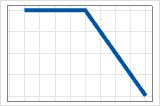
- max(0, X − c)
- Negative coefficient
- The contribution is the maximum until c, then decreases.
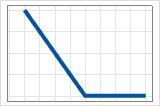
- max(0, c − X)
- Positive coefficient
- The contribution starts at the maximum and decreases until c. After c,
the contribution is 0.
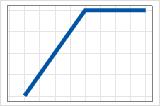
- max(0, c − X)
- Negative coefficient
- The contribution begins at 0 and increases until c. After c, the
contributions is at the maximum value.
If c equals the minimum or the maximum value of the predictor, then the predictor has the same effect for all values of the basis function. The partial dependence plot for these 2 cases shows a straight line. MARS® Regression makes c one of the endpoints in an analysis that disallows transformations for the predictor.
For categorical predictors, basis functions are indicator functions. The function has a value of 0 for some categories and a value of 1 for the other categories. The basis functions have the following form:
When X is x1, … xk where k is the number of levels in the basis function, k ≥ 1.
The value of the function is 1 for the categories in the basis function. Multiplication of the basis function by the coefficient in the regression equation determines the effect when the function changes from 0 to 1.
Example of a continuous predictor in 1 basis function
In these results, BF2 has a negative coefficient in the regression equation. The coefficient for the basis function is −57.6167. The arrangement of the basis function is max(0, c − X). In this arrangement, the value of the basis function decreases when the predictor increases. The combination of this arrangement and the negative coefficient creates a positive relationship between the predictor variable and the response variable. The effect of Living Area SF is to increase Sale Price in the region from 438 to 3,078. The slope of Living Area SF is 57.6167 from 438 to 3,078.
Regression Equation
BF3 = when Quality is 8, 9, 10
BF6 = max(0, 2002 - Year Built)
BF7 = when Basement SF 1 is not missing
BF10 = max(0, 1696 - Basement SF 1) * BF7
BF11 = when Quality is 1, 8
BF13 = when Type is 90, 150, 160, 180, 190
BF15 = when Neighborhood is Blueste, ClearCr, Crawfor, GrnHill, Landmrk, NoRidge, NridgHt,
Somerst, StoneBr, Timber, Veenker
BF17 = when Total Basement SF is not missing
BF19 = max(0, Total Basement SF - 1392) * BF17
BF21 = max(0, 1st Floor SF - 2402)
BF23 = when Condition is 1, 2, 3, 4, 5, 6
BF25 = when Quality is 1, 7, 10
BF27 = max(0, 1st Floor SF - 2207)
BF30 = max(0, 15138 - Lot Area)
Sale Price = 325577 - 57.6167 * BF2 + 115438 * BF3 - 605.079 * BF6 - 25.3989 * BF10 -
66735.2 * BF11 - 23688.9 * BF13 + 22374.5 * BF15 + 50.3801 * BF19 - 576.789 * BF21 - 18099.2
* BF23 + 22414.2 * BF25 + 361.254 * BF27 - 1.82 * BF30
One predictor partial dependence plot
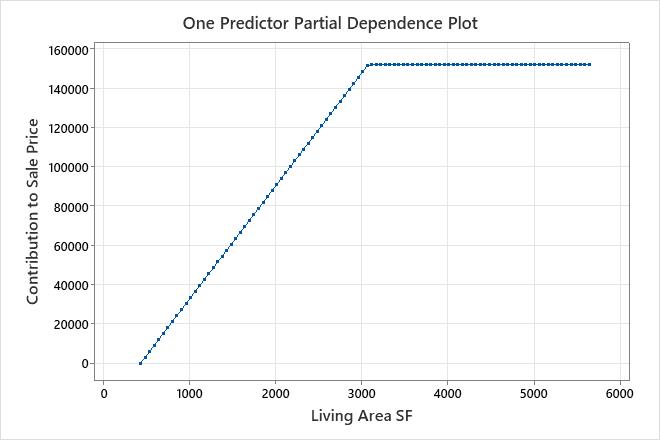
In an additive model, use the one-predictor, partial dependence plots to gain insight into how the important continuous predictors affect the predicted response. The one predictor partial dependence plot indicates how the response is expected to change with changes in the predictor levels. For MARS® Regression, the values on the plot come from the basis functions for the predictor on the x-axis. The contribution on the y-axis is standardized so that the minimum value on the plot is 0.
This plot illustrates that Sale Price increases as the Living Area SF increases from the minimum square footage in the data set to about 3,000 square feet. After Living Area SF reaches 3,000 square feet, the contribution to Sale Price becomes flat at approximately $152,000.
Example of a categorical predictor in 1 basis function
In these results, BF3 is for the predictor Quality. The basis function is for when the value of Quality is 8, 9, or 10. The coefficient for BF3 in the equation is 115,438. This basis function indicates that when the value of quality changes from a value of 1 to 7 to a value of 8, 9, or 10, the sale price increases by $115,438 in the model. Quality is also in BF11 and BF25. To understand the effect of the predictor on the response variable, consider all the basis functions.
Regression Equation
BF3 = when Quality is 8, 9, 10
BF6 = max(0, 2002 - Year Built)
BF7 = when Basement SF 1 is not missing
BF10 = max(0, 1696 - Basement SF 1) * BF7
BF11 = when Quality is 1, 8
BF13 = when Type is 90, 150, 160, 180, 190
BF15 = when Neighborhood is Blueste, ClearCr, Crawfor, GrnHill, Landmrk, NoRidge, NridgHt,
Somerst, StoneBr, Timber, Veenker
BF17 = when Total Basement SF is not missing
BF19 = max(0, Total Basement SF - 1392) * BF17
BF21 = max(0, 1st Floor SF - 2402)
BF23 = when Condition is 1, 2, 3, 4, 5, 6
BF25 = when Quality is 1, 7, 10
BF27 = max(0, 1st Floor SF - 2207)
BF30 = max(0, 15138 - Lot Area)
Sale Price = 325577 - 57.6167 * BF2 + 115438 * BF3 - 605.079 * BF6 - 25.3989 * BF10 -
66735.2 * BF11 - 23688.9 * BF13 + 22374.5 * BF15 + 50.3801 * BF19 - 576.789 * BF21 - 18099.2
* BF23 + 22414.2 * BF25 + 361.254 * BF27 - 1.82 * BF30
Note
In a traditional regression equation, the coefficient in the regression equation always represents the change from 0 to 1. In MARS® Regression, the coefficient can represent the change from 1 to 0. Consider a binary categorical variable that is 0 when a patient reports that they do not have a headache and 1 when a patient reports that they have a headache. Suppose that the predictor has the following basis function:
- BF1 = when Headache is 0
Multiple basis functions for 1 predictor
MARS® Regression uses multiple basis functions for a single predictor to model more complex nonlinear relationships between a predictor and the response. Additional basis functions create additional changes in the slope of the relationship between the predictor and the response variable. MARS® Regression allows predictors in multiple basis functions in additive models.
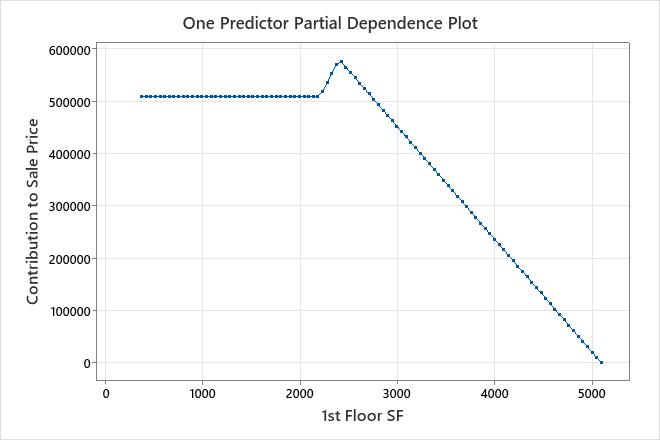
In these results, BF21 is for the predictor 1st Floor SF. The basis function BF27 is also for 1st Floor SF. BF21 and BF27 both have the same arrangement, max(0, X − c). Basis functions in this arrangement affect the response variable when the predictor has a value greater than c. For 2 basis functions with this arrangement, neither basis function affects the response until the predictor reaches the minimum value in 1 of the basis functions. In these results, that value is 2,207 in BF27. 1st Floor SF has a slope of 0 from the minimum value until 2,207. After 2,207, the slope from BF27 applies, which results in a slope of 361.254. This slope persists until predictor reaches the constant in BF21, at which point the coefficients from both BF27 and BF21 affect Sale Price. The sum of the two coefficients gives the new slope, 361.254 + (−576.789) = −215.535. In an additive model, MARS® Regression displays a one-predictor, partial dependence plot to show the effect of the predictor.
Regression Equation
BF3 = when Quality is 8, 9, 10
BF6 = max(0, 2002 - Year Built)
BF7 = when Basement SF 1 is not missing
BF10 = max(0, 1696 - Basement SF 1) * BF7
BF11 = when Quality is 1, 8
BF13 = when Type is 90, 150, 160, 180, 190
BF15 = when Neighborhood is Blueste, ClearCr, Crawfor, GrnHill, Landmrk, NoRidge, NridgHt,
Somerst, StoneBr, Timber, Veenker
BF17 = when Total Basement SF is not missing
BF19 = max(0, Total Basement SF - 1392) * BF17
BF21 = max(0, 1st Floor SF - 2402)
BF23 = when Condition is 1, 2, 3, 4, 5, 6
BF25 = when Quality is 1, 7, 10
BF27 = max(0, 1st Floor SF - 2207)
BF30 = max(0, 15138 - Lot Area)
Sale Price = 325577 - 57.6167 * BF2 + 115438 * BF3 - 605.079 * BF6 - 25.3989 * BF10 -
66735.2 * BF11 - 23688.9 * BF13 + 22374.5 * BF15 + 50.3801 * BF19 - 576.789 * BF21 - 18099.2
* BF23 + 22414.2 * BF25 + 361.254 * BF27 - 1.82 * BF30
Basis functions for missing values
In the search for the basis functions, MARS® Regression creates indicator variables for any predictors with missing values. The indicator variable shows whether a value of the predictor is missing. If the analysis includes a basis function for a predictor with missing values in the model, then the model also includes a basis function for the indicator variable. The other basis functions for the predictor all interact with the basis function for the indicator variable.
When a predictor has a missing value, the basis function for the indicator variable nullifies the other basis functions for that predictor through multiplication by 0. These basis functions for missing values are in all models where important predictors have missing values, even additive models and models that disable other types of transformations.
In these results, BF7 is for the predictor Basement SF 1. BF 7 has a value of 1 when Basement SF 1 is in the data. BF 7 has a value of 0 when Basement SF 1 is missing. BF7 is not present in the regression equation because the basis function was not important in the final model, but BF7 interacts with BF10. BF10 is important and is present in the regression equation. The effect of BF7 is to multiply BF10 by 0 when Basement SF 1 is missing, which removes the effect when Basement SF 1 is missing.
Regression Equation
BF3 = when Quality is 8, 9, 10
BF6 = max(0, 2002 - Year Built)
BF7 = when Basement SF 1 is not missing
BF10 = max(0, 1696 - Basement SF 1) * BF7
BF11 = when Quality is 1, 8
BF13 = when Type is 90, 150, 160, 180, 190
BF15 = when Neighborhood is Blueste, ClearCr, Crawfor, GrnHill, Landmrk, NoRidge, NridgHt,
Somerst, StoneBr, Timber, Veenker
BF17 = when Total Basement SF is not missing
BF19 = max(0, Total Basement SF - 1392) * BF17
BF21 = max(0, 1st Floor SF - 2402)
BF23 = when Condition is 1, 2, 3, 4, 5, 6
BF25 = when Quality is 1, 7, 10
BF27 = max(0, 1st Floor SF - 2207)
BF30 = max(0, 15138 - Lot Area)
Sale Price = 325577 - 57.6167 * BF2 + 115438 * BF3 - 605.079 * BF6 - 25.3989 * BF10 -
66735.2 * BF11 - 23688.9 * BF13 + 22374.5 * BF15 + 50.3801 * BF19 - 576.789 * BF21 - 18099.2
* BF23 + 22414.2 * BF25 + 361.254 * BF27 - 1.82 * BF30
Basis functions for interactions
To model interactions, MARS® Regression multiplies basis functions for different predictors. MARS® Regression does not consider interactions in the default, additive model. Partial dependence plots are not available for an analysis that considers interactions.
An interaction means that the effect of a predictor depends on the value of other predictors. For example, the rate at which grain dries in an oven depends on the time in the oven, but the effect of time depends on the temperature of the oven. The time and temperature variables interact.
In the results for a model with interactions, BF9 is for the predictor Quality. BF12 is for the predictor 1st Floor SF. The calculation of BF12 includes multiplication by BF9, so the two predictors interact. Determination of the effect of Quality or 1st Floor SF requires knowledge of the value of the other predictor. The coefficient for BF12 of −63.1685 applies only when the value of BF9 is 1. The value of BF9 is 1 when Quality is 8, 9, or 10. Because of the arrangement of BF12, 1st Floor SF has a slope of 63.1685 when the square footage is less than 2,470 and the value of Quality is 8, 9, or 10.
Regression Equation
BF4 = max(0, 2002 - Year Built)
BF5 = when Basement SF 1 is not missing
BF7 = max(0, Basement SF 1 - 1758) * BF5
BF8 = max(0, 1758 - Basement SF 1) * BF5
BF9 = when Quality is 8, 9, 10
BF12 = max(0, 2470 - 1st Floor SF) * BF9
BF14 = when Quality is 7, 9, 10
BF15 = when Type is 75, 90, 150, 160, 180, 190
BF19 = when Neighborhood is Blueste, ClearCr, Crawfor, Greens, GrnHill, NoRidge, NridgHt,
Somerst, StoneBr, Timber, Veenker * BF5
BF21 = when Condition is 1, 2, 3, 4, 5, 6 * BF4
BF25 = max(0, 1st Floor SF - 372) * BF7
BF26 = when Total Basement SF is not missing * BF14
BF28 = max(0, Total Basement SF - 689) * BF26
Sale Price = 320349 - 66.4387 * BF2 - 28.2065 * BF8 + 123645 * BF9 - 63.1685 * BF12 -
23751.7 * BF15 + 22818.2 * BF19 - 523.924 * BF21 - 0.036887 * BF25 + 53.9878 * BF28