Note
This command is available with the Predictive Analytics Module. Click here for more information about how to activate the module.
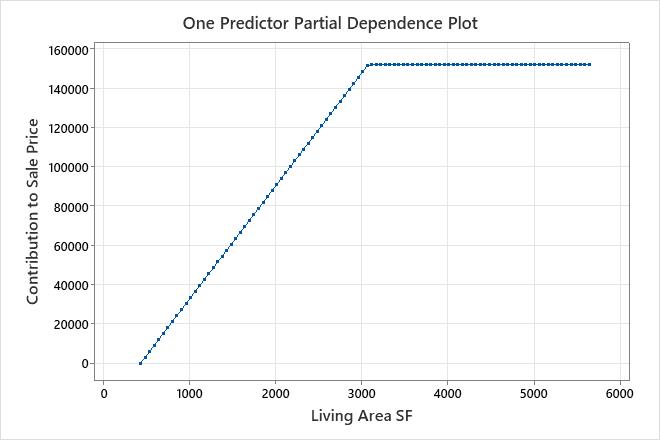
Use the partial dependence plots to gain insight into how the
important variables affect the predicted response.
The results for an additive model include partial dependence plots for continuous predictors that are important in the model. Use the plot to see the effect of all the basis functions for a predictor across the range of the predictor.
In these results, the partial dependence plot shows that the slope of Living Area SF is about 57.6 when Living Area SF is 438 to 3,078. The slope is 0 when Living Area SF is greater than 3,078.