By default, Minitab displays the smallest tree with an R2 value that is within one standard error of the maximum R2 value.
Right-click the tree diagram to perform the following interactions:
- Highlight the 5 nodes with the least variation from the fitted value for the node. These nodes are the optimal nodes.
- Highlight the 5 nodes with the highest means or medians, depending on the criterion for the tree.
- Highlight the 5 nodes with the lowest means or medians, depending on the criterion for the tree.
- Copy the values of the predictors that lead to a node that you select. These values are the node rules.
- Show the Node Split View. This view is helpful when you have a large tree and want to see only which variables split the nodes.
The root node is the top node of the tree and is the only node that does not have parents. At each node, the data is split into 2 children, depending on the characteristics of the data. Nodes continue to split until the tree runs out of data to split. In other words, the terminal nodes cannot be split into further groupings.
When you validate the performance of the tree with a test data set, the tree diagram shows cases from the training data set.
Interpretation
Each node contains details on the mean, standard deviation, and count.
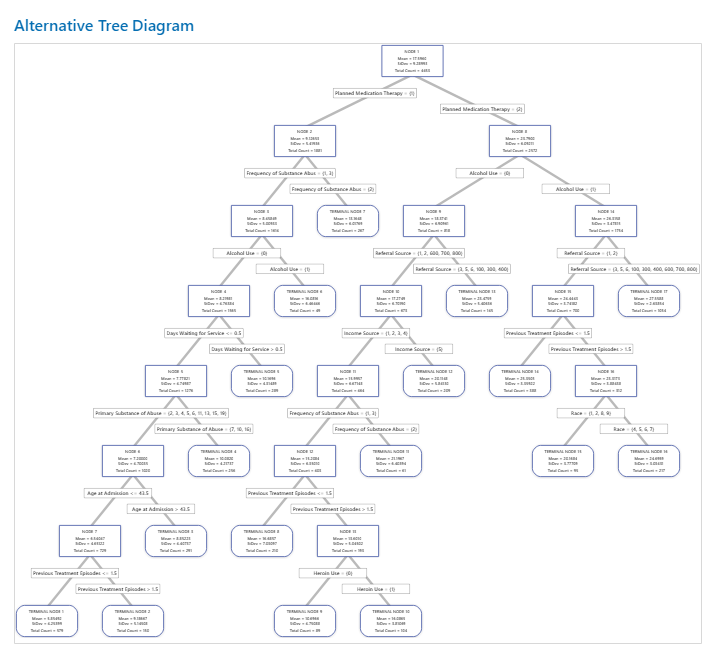
- Node ID
- Gives the node or terminal node designation. The terminal node is a final node that cannot be split further.
- Mean
- The mean is the mean response value of the cases in the node. The mean is the predicted value for new data that fall in the same node. Terminal nodes with means that are the most different from the other terminal nodes can be of special interest because the predictions for cases in those terminal nodes are the most different. For example, the largest or smallest means can be of special interest.
- Standard deviation
- The standard deviation is the standard deviation of the response values in the node. Terminal nodes with smaller standard deviations can be of special interest because the predictions from these nodes are more precise than for terminal nodes with larger standard deviations.
- Total Count
- The total count is the number of cases in the node. If the analysis includes weights, then the count is the total weighted count. Terminal nodes with many cases can be of special interest because these nodes typically represent more common cases.