Interpretation
Residuals summarize the error in a node and can help identify cases with poor fit. You can have the most confidence in the fits of nodes with small residuals relative to the scale of the response variable. Nodes with a wider spread of residuals can represent opportunities to reduce or explain more variation. You can choose whether to investigate cases that show unusual patterns.
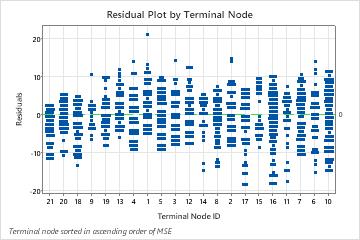
By default, the nodes are in order from least error to greatest error. When you run the analysis, you can find an option to sort the nodes by identification number by pressing the Graphs button.
When the analysis uses a test data set, the graph includes separate plots for the training and test data. The performance of the tree on the test data is a typically a better representation of how the tree performs for new data. You should investigate large differences between the test and training data.
In the following plot, terminal node 1 contains the largest residual. Terminal node 13 has a trail of negative residuals. More investigation of these points could reveal the reason that the tree does not fit these points as well as other points in the node. Terminal node 17 has the smallest MSE of the terminal nodes. The range of the residuals in terminal node 17 is relatively small compared to the nodes on the other side of the plot.