Use the relative variable importance chart to determine which predictors are the most important variables to the classification tree.
The Relative variable importance graph plots the predictors in order of their effect on model improvement. An important variable is a variable that is used as a primary or surrogate splitter in the tree. The variable with the highest improvement score is set as the most important variable, and the other variables follow in order of importance. Relative variable importance standardizes the importance values for ease of interpretation. Relative importance is defined as the percent improvement with respect to the most important predictor, which has an importance of 100%.
Relative importance is calculated by dividing each variable importance score by the largest importance score of the variables, then we multiply by 100%.
Interpretation
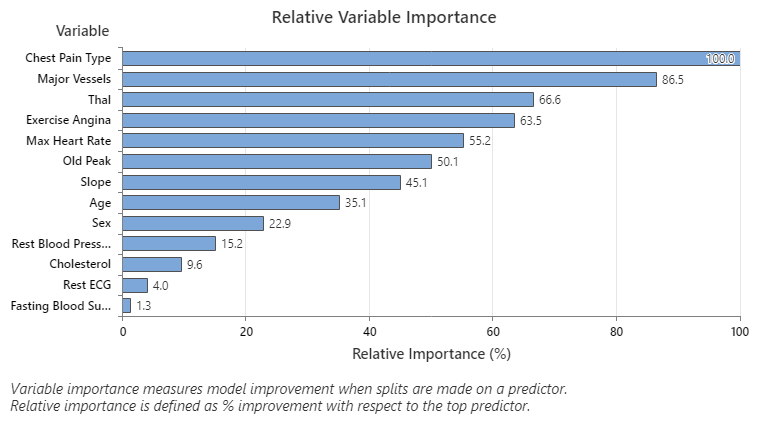
In this example, the most important predictor variable is Chest Pain Type. If you count the contribution of the top predictor variable, Chest Pain Type, as 100%, then the next important variable, Major Vessels, has a contribution of 86.5%. This means Major Vessels is 86.5% as important as Chest Pain Type in your chosen classification tree.