An engineer wants to assess the effect of sintering time on the compressive strength of three different metals. The engineer measures the compressive strength of three specimens of each metal type at each sintering time: 100 minutes, 150 minutes, and 200 minutes.
The engineer creates variability charts to look for possible trends and interactions in the data.
- Open the sample data, SinteringTime.MWX.
- Choose .
- In Responses, enter Strength.
- In Factors (1-8, outermost first), enter MetalType and SinterTime.
- Select Standard deviation chart.
- Click OK.
Interpret the results
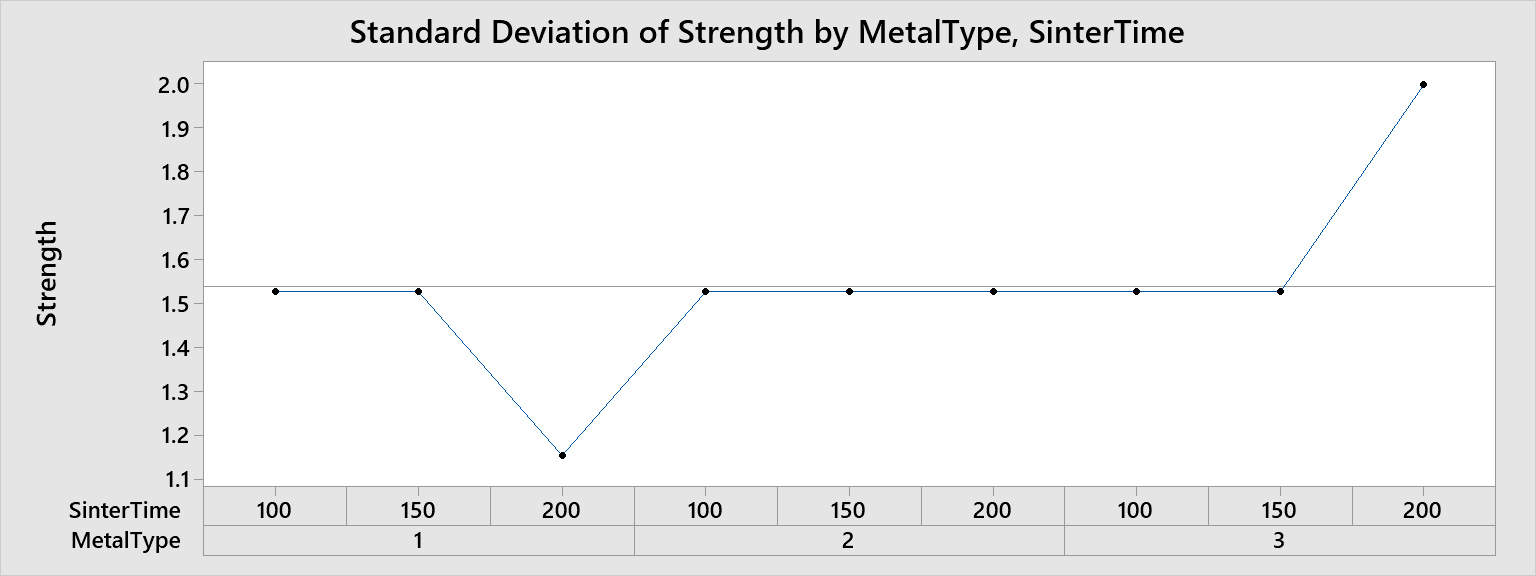
The first chart is the average response with variation chart that shows the strength measurement values and the range of each cell that is formed by the combination of the two factors–MetalType and SinterTime. The second chart shows the standard deviation for each combination of the two factors.
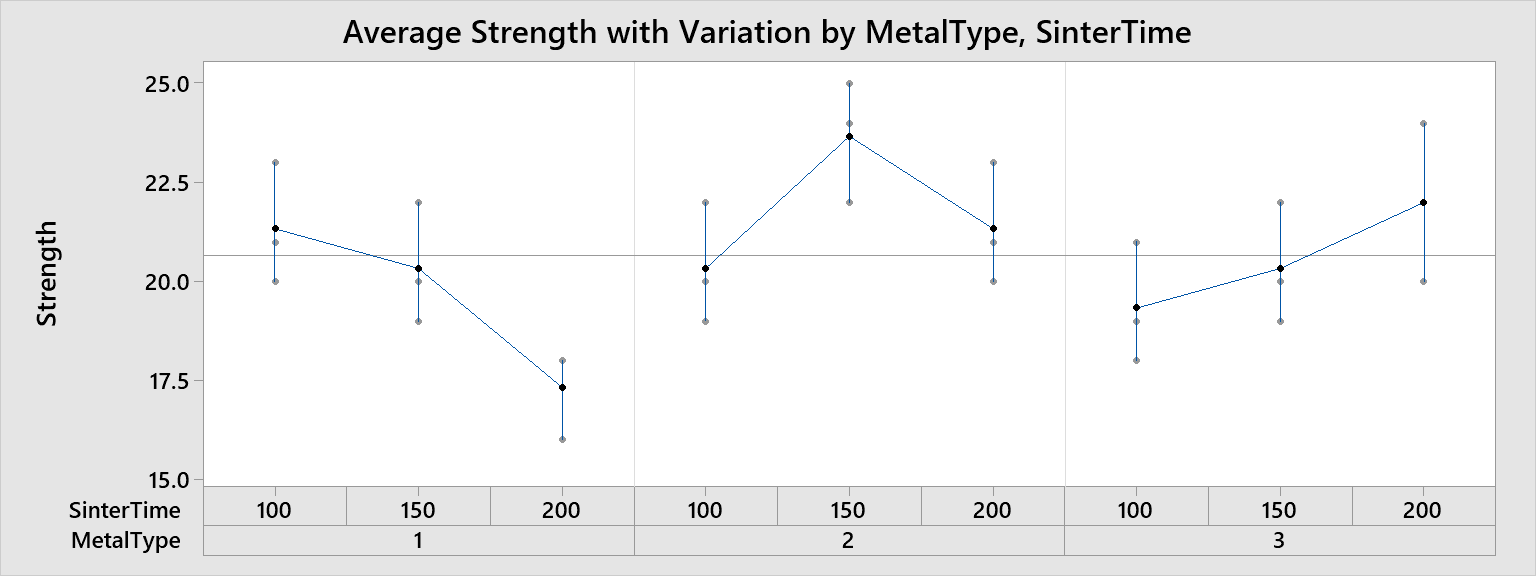
Strength varies differently across metal types for each sintering time. The difference indicates a possible interaction.
The variability charts indicate a possible interaction between the type of metal and the length of sintering time. The greatest compressive strength for Metal Type 1 is obtained by sintering for 100 minutes, for Metal Type 2 by sintering for 150 minutes, and for Metal Type 3 by sintering for 200 minutes. Also, the standard deviation chart shows relatively constant standard deviations for the sinter times of 100 and 150, but varies more with the sintering time of 200.
To quantify this interaction and to determine whether it is statistically significant, the engineer could further analyze this data with an ANOVA (analysis of variance) or a general linear model.