In This Topic
What is a stage?
Use stages to create a historical control chart that shows how a process changes over specific periods of time. By default, Minitab recalculates the center line and control limits for each stage. You can calculate the parameters for a stage from the data or enter the historical parameters for every stage.
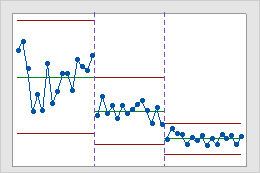
A process with three stages
This historical control chart shows three stages of a process, which represent before, during, and after the implementation of a new procedure.
Example of adding stages to an Xbar chart
Suppose you want to create an Xbar chart for data in C1, using a subgroup size of 5. C2 is an indicator variable that contains the values "Benchmark" and "Improvement." These values show where the shift has occurred. You want to recalculate the control limits after the value in C2 changes from "Benchmark" to "Improvement."
- Choose .
- Choose All observations for a chart are in one column, then enter C1.
- In Subgroup sizes, enter 5.
- Click Xbar Options, then click the Stages tab.
- In Define stages (historical groups) with this variable, enter C2.
- Under When to start a new stage, select With each new value.
- Click OK in each dialog box.
Specify historical parameters for stages
- Enter one parameter value.
- Enter a separate parameter value for each stage.
- Enter parameter values for some stages and asterisks for the remaining stages.
Consider the following example. You create an I chart with 3 stages and you want to specify the mean.
- In the dialog box, click I Chart Options and click the Parameters tab.
- In Mean, do one of the following:
- Enter a single mean for all stages, for example, 1.2. Minitab uses 1.2 as the mean for all 3 stages.
- Enter a mean for each stage, for example, 1.2 1.5 1.75. Minitab uses these values as the means for stages 1, 2, and 3, respectively.
- Enter means for some stages and asterisks for the remaining stages, for example, 1.2 * 1.75. Minitab estimates the mean for stage 2 from the data and uses 1.2 as the mean for stage 1 and 1.75 as the mean for stage 3.
If you enter more than one value for a parameter, but fewer values than the number of stages, then Minitab displays the following error: "Incorrect number of means (or proportions)".
Display labels for the control limits of each stage
You can choose to display labels for the control limits and center line values for all stages. If you don't display the labels for all stages, you can still view them by pausing your cursor over the lines.
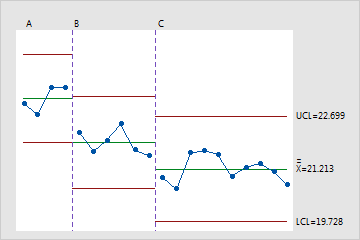
Display labels only for the final stage
This is the default setting.
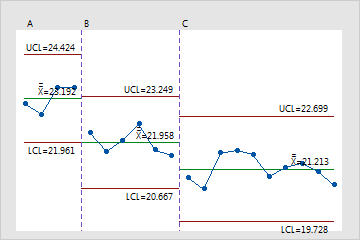
Display labels for all stages
You must choose to display labels for all stages.
To display labels for all stages:
- In the dialog box, click the chart options button (for example, Xbar Options), then click the Display tab.
- Under Other, select Display control limit / center line labels for all stages.