The sales manager of a computer software company monitors the sales figures and sales visits from the previous 26 weeks. Because the number of sales visits each week impacts the amount of sales, the manager wants to monitor these variables at the same time.
The sales manager creates a T2 chart to simultaneously monitor the mean of sales figures and sales visits over 26 weeks.
- Open the sample data, SoftwareSales.MWX.
- Choose .
- In Variables, enter Sales On-Site Visits.
- In Subgroup sizes, enter Week.
- Click OK.
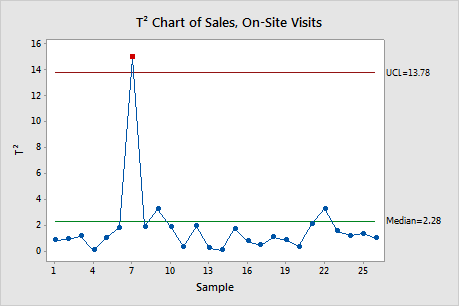
Interpret the results
The T2 chart shows that the process is out-of-control at point 7. The sales manager should investigate the sales data from week 7 to determine why this point is out of control.
Test Results for T² Chart of Sales, On-Site Visits
| Point | Variable | P-Value | |
|---|---|---|---|
| Greater Than UCL | 7 | Sales | 0.0000 |
| On-Site Visits | 0.0030 |