What is Z.bench?
You can use Z.bench values to describe the sigma capability of your process. Because they are based on a standard normal distribution, Z.bench statistics are benchmark values that allow you to easily compare process capability.
To understand Z.bench, consider all the defects of a process, which usually fall on either side of the specification limits.
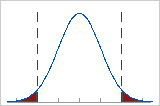
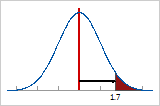
If you put all the defects on the right tail of the distribution, and then measure the number of standard deviations from the center to the point that defines the total defects, you obtain the Z.bench value.
What are the different Z.bench values?
- Short-term Z.bench (Z.benchST)
- Short-term Z.bench is calculated using the within-standard deviation of the process. It is a measure of how your current process would perform if you could keep the short-term variation constant, which is ideal, or the process entitlement.
- Long-term Z.bench (Z.benchLT)
- Long-term Z.bench is calculated using the overall standard deviation of the process. It is a better measure of reality because we can't usually hold the short-term variation over time. It represents the quality the customer actually receives.
- Z Shift
- Is the difference between Z.benchST and Z.benchLT. The larger the Z shift, the more opportunity you have for improvement if you are able to better control your process and eliminate or reduce the special causes that create the between-subgroup variation.
How to display Z.bench
You can perform a normal capability analysis and display Z.bench statistics for continuous data. Suppose the data are in C1, the subgroup size is 5, the lower specification limit is 598, and the upper specification limit is 602. Also assume that the data come from a normal distribution and the process is in statistical control.
- Choose .
- In Single column, enter C1.
- In Subgroup size, enter 5.
- In Lower spec, enter 598. In Upper spec, enter 602.
- Click Options. Choose Benchmark Z’s (σ level).
- Click OK in each dialog box.
Using Z.bench to estimate sigma capability
Z.bench is often used to estimate the sigma capability of a process. However, the exact method used may differ depending on industry practices or company standards. Some practitioners report sigma capability as the short-term Z.bench value under potential (within) capability, which uses the standard deviation within subgroups. Other practitioners define sigma capability as 1.5 plus the long-term Z.bench value in overall capability, which uses the overall standard deviation of the process. (For example, if the Z.bench under overall capability is 4, the sigma capability is 4 + 1.5 = 5.5.) Therefore, when reporting sigma capability, you should confirm the specific guidelines used in your company or industry.
| Z.bench | Sigma Capability | PPM Defective |
|---|---|---|
| 1 | 2.5σ | 158,655 |
| 2 | 3.5σ | 22,750 |
| 3 | 4.5σ | 1,350 |
| 4 | 5.5σ | 32 |
| 4.5 | 6.0σ | 3.4 |
Note
In the table, sigma capability is calculated assuming a Z shift of 1.5σ