Complete the following steps to specify the data for your graph.
- From Function, select the function of the data that you want to graph.
- In Graph variables, enter multiple columns of numeric or date/time data that you want to graph.
- In Categorical variable for grouping, enter the column of categorical data that defines groups.
- From Grouping by Graph Variables, select one of the following:
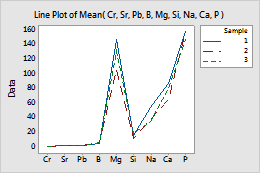
- Graph variables are X-scale groups: Graph variables are the groups on the X-scale. On the graph below, graph variables are the X-scale groups.
- Graph variables are legend groups: Graph variables are the series, identified on the legend and the categorical variable defines the X-scale groups.
In this worksheet, Cr, Sr, Pb, and so on are the graph variables. Sample is the categorical data. The graph shows a series for each sample of the concentration of each element.
| C1 | C2 | C3 | C4 | ... | C10 |
|---|---|---|---|---|---|
| Cr | Sr | Pb | B | ... | Sample |
| 0.063 | 0.192 | 0.777 | 5.56 | ... | 1 |
| 0.021 | 0.172 | 0.232 | 3.79 | ... | 1 |
| 0.021 | 0.358 | 0.035 | 4.34 | ... | 1 |
| ... | ... | ... | ... | ... | ... |