Single
Create an empirical CDF plot that displays the distribution of values for one variable. For example, the following empirical CDF plot shows the distribution of the amount of torque that is required to remove the caps for a sample of shampoo bottles.
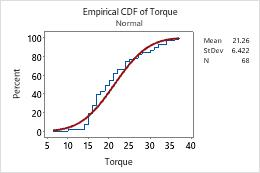
For more information, go to Create a single empirical CDF plot.
Multiple
Create an empirical CDF plot that displays the distribution of values for multiple groups. For example, the following empirical CDF plot shows the distribution of torque values for the two machines that tightened the caps.
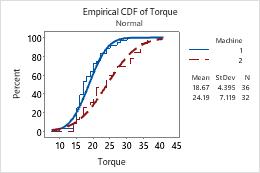
For more information, go to Create a multiple Empirical CDF Plot.