In This Topic
Chart of contribution to the chi-square value
This bar chart plots each category's contribution to the overall chi-square statistic. You can choose a chart that orders the categories by contribution, from largest contribution to smallest contribution.
Interpretation
Categories with a large difference between observed and expected values make a larger contribution to the overall chi-square statistic.
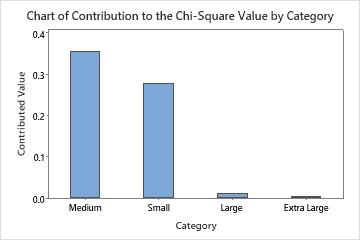
This bar chart indicates that the largest contribution to the chi-square statistic is in the Medium category.
Chart of observed and expected values
Use a bar chart that plots the observed and expected values for each category to determine whether there is a difference in a particular category.
If you determined that the difference between the observed and expected counts is statistically significant, you can use this bar chart to determine which categories have the largest difference between observed and expected values.
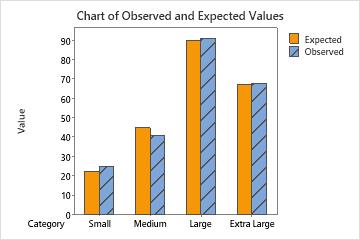
This bar chart indicates that the observed values are very similar to the expected values for each category. Thus, the bar chart visually confirms what the p-value indicates — that you cannot conclude that the observed proportions are significantly different from the specified proportions.
Chi-Sq and contribution to Chi-Sq
Use the individual category contributions to quantify how much of the total chi-square statistic is attributable to each category's difference between observed and expected values.
Minitab calculates each category's contribution to the chi-square statistic as the square of the difference between the observed and expected values for a category, divided by the expected value for that category. The chi-square statistic is the sum of these values for all the categories.
Interpretation
Categories with a large difference between observed and expected values make a larger contribution to the overall chi-square statistic.
Observed and Expected Counts
| Category | Observed | Test Proportion | Expected | Contribution to Chi-Square |
|---|---|---|---|---|
| Small | 25 | 0.1 | 22.5 | 0.277778 |
| Medium | 41 | 0.2 | 45.0 | 0.355556 |
| Large | 91 | 0.4 | 90.0 | 0.011111 |
| Extra Large | 68 | 0.3 | 67.5 | 0.003704 |
Chi-Square Test
| N | DF | Chi-Sq | P-Value |
|---|---|---|---|
| 225 | 3 | 0.648148 | 0.885 |
DF
The degrees of freedom for the chi-square goodness-of-fit test is the number of categories minus 1.
Interpretation
Minitab uses the degrees of freedom to determine the p-value. The more categories you have in your study, the more degrees of freedom you have.
In these results, the degrees of freedom (DF) is 3.
Chi-Square Test
| N | DF | Chi-Sq | P-Value |
|---|---|---|---|
| 225 | 3 | 0.648148 | 0.885 |
N
N is the total sample size. N equals the sum of all the observed counts.
Interpretation
In these results, the total sample size (N) is 225.
Observed and Expected Counts
| Category | Observed | Test Proportion | Expected | Contribution to Chi-Square |
|---|---|---|---|---|
| Small | 25 | 0.1 | 22.5 | 0.277778 |
| Medium | 41 | 0.2 | 45.0 | 0.355556 |
| Large | 91 | 0.4 | 90.0 | 0.011111 |
| Extra Large | 68 | 0.3 | 67.5 | 0.003704 |
Chi-Square Test
| N | DF | Chi-Sq | P-Value |
|---|---|---|---|
| 225 | 3 | 0.648148 | 0.885 |
Observed and expected values
The observed values are the actual number of observations in a sample that belong to a category.
The expected values are the number of observations that you would expect to occur, on average, if the test proportions were true. Minitab calculates the expected counts by multiplying the test proportions from each category by the total sample size.
Interpretation
You can compare the observed values and the expected values by using the output table or the bar chart.
Observed and Expected Counts
| Category | Observed | Test Proportion | Expected | Contribution to Chi-Square |
|---|---|---|---|---|
| Small | 25 | 0.1 | 22.5 | 0.277778 |
| Medium | 41 | 0.2 | 45.0 | 0.355556 |
| Large | 91 | 0.4 | 90.0 | 0.011111 |
| Extra Large | 68 | 0.3 | 67.5 | 0.003704 |
P-value
The p-value is a probability that measures the evidence against the null hypothesis. Lower probabilities provide stronger evidence against the null hypothesis.
Use the p-value to determine whether to reject or fail to reject the null hypothesis, which states that the population proportions in each category are consistent with the specified values in each category.
Interpretation
- P-value ≤ α: The observed data are statistically different from the expected values (Reject H0)
- If the p-value is less than or equal to the significance level, you reject the null hypothesis and conclude that the data does not follow a distribution with certain proportions. Use your specialized knowledge to determine whether the difference is practically significant.
- P-value > α: You cannot conclude that the observed data are statistically different from the expected values (Fail to reject H0)
- If the p-value is larger than the significance level, you fail to reject the null hypothesis because you do not have enough evidence to conclude that the data do not follow the distribution with specified proportions. However, you cannot conclude that the distributions are the same. A difference might exist, but your test might not have enough power to detect it.
In these results, the p-value is 0.885. Because the p-value is greater than the chosen α value of 0.05, you fail to reject the null hypothesis. Therefore, you cannot conclude that observed proportions are significantly different from the specified proportions.
Chi-Square Test
| N | DF | Chi-Sq | P-Value |
|---|---|---|---|
| 225 | 3 | 0.648148 | 0.885 |