Step 1: Determine whether the data do not follow a normal distribution
To determine whether the data do not follow a normal distribution, compare the p-value to the significance level. Usually, a significance level (denoted as α or alpha) of 0.05 works well. A significance level of 0.05 indicates a 5% risk of concluding that the data do not follow a normal distribution when the data do follow a normal distribution.
P-value ≤ α: The data do not follow a normal distribution (Reject H0)
If the p-value is less than or equal to the significance level, the decision is to reject the null hypothesis and conclude that your data do not follow a normal distribution.
P-value > α: You cannot conclude that the data do not follow a normal distribution (Fail to reject H0)
If the p-value is larger than the significance level, the decision is to fail to reject the null hypothesis. You do not have enough evidence to conclude that your data do not follow a normal distribution.
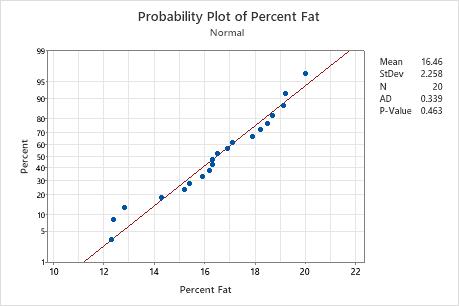
Key Result: P-Value
In these results, the null hypothesis states that the data follow a normal distribution. Because the p-value is 0.463, which is greater than the significance level of 0.05, the decision is to fail to reject the null hypothesis. You cannot conclude that the data do not follow a normal distribution.
Step 2: Visualize the fit of the normal distribution
To visualize the fit of the normal distribution, examine the probability plot and assess how closely the data points follow the fitted distribution line. Normal distributions tend to fall closely along the straight line. Skewed data form a curved line.
Right-skewed data
Left-skewed data
Tip
In Minitab, hold your pointer over the fitted distribution line to see a chart of percentiles and values.
In this probability plot, the data form an approximately straight line along the line. The normal distribution appears to be a good fit to the data.