TreeNet® models are an approach to solving classification and
regression problems that are both more accurate and resistant to overfitting
than a single classification or regression tree. A broad, general description
of the process is that we begin with a small regression tree as an initial
model. From that tree come residuals for every row in the data which become the
response variable for the next regression tree. We build another small
regression tree to predict the residuals from the first tree and compute the
resulting residuals again. We repeat this sequence until an optimal number of
trees with minimum prediction error is identified using a validation method.
The resulting sequence of trees makes the TreeNet® Classification
Model.
For the classification case, we can add some more mathematical detail for an
analysis with a binary response and for an analysis with a multinomial
response.
Binary response
The creation of the model uses the following information:
The response variable,
,
takes the following values: {-1, 1}.
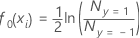
The initial fitted values for
the calculation of the generalized residuals have the following form:
Where
is the number of events and
is the number of nonevents.
The model creation also uses the following inputs from the analyst:
Input
Symbol
learn
rate
sampling
rate
maximum number of terminal nodes per
tree
number of
trees
The process has the following general steps for growing the
jth tree,
j=1,...,J:
Draw a random sample of size
s *
N from the training data, where
N is the number of rows in the training data.
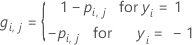
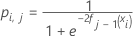
Calculate the generalized
residuals,
gi, j, for :
where
and
is a vector that represents the
ith row of the predictor values in the training data.
Fit a regression tree with at
most
M terminal nodes to the generalized residuals. The tree partitions
the observations into at most
M mutually exclusive groups.
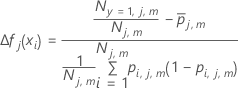
For the
mth terminal node in the regression tree, calculate the
within-node updates for fitted values from the previous tree as follows:
where
Term
Description
number of events in terminal node
m at tree
j
number of cases in terminal node
m at tree
j
arithmetic mean of
for all cases in terminal node
m at tree
j
Shrink the within-node updates
by the learning rate and apply the values to get the updated fitted values,
fj(xi):
Repeat steps 1-5 for each of
the
J trees in the analysis.
Multinomial response
For a multinomial response with K levels, the analysis fits a tree to each
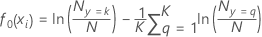
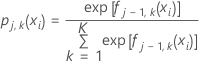
level of the response variable at each iteration. The initial fitted values for
the calculation of the generalized residuals for one of the trees has the
following form:
where
is the number of cases where the response value is
k and
N is the number of rows in the training data.
The model creation also uses the following inputs from the analyst:
Input
Symbol
learn
rate
sampling
rate
maximum number of terminal nodes per
tree
number of
trees
The calculation of the probabilities from the fits accounts for the
dependent nature of these trees. Otherwise, the process is substantially the
same as for the binary case.
Draw a random sample of size
s *
N from the training data, where
N is the number of rows in the training data set.
Calculate the generalized
residuals,
gi, j, k for ,
,
the number of trees in the analysis, and ,
the number of levels of the response variable:
where
and
is a vector that represents the
ith row of the predictor values in the training data
set.
For example, the probability for an outcome coded as 1 from a
multinomial response with 3 levels has the following form:
where
is the fit for the
ith row at the
j–1 tree for the
kth level of the response variable.
Fit a regression tree with at
most
M terminal nodes to the generalized residuals. The tree partitions
the observations into at most
M mutually exclusive groups.
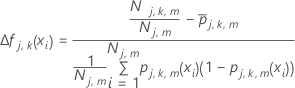
For the
mth terminal node in the
jth regression tree, calculate the within-node updates
for fitted values from the previous tree as follows:
where
Term
Description
number of cases for outcome
k in terminal node
m at tree
j
number of cases in terminal node
m at tree
j
arithmetic mean of
for all cases in terminal node
m at tree
j.
Shrink the within-node updates
by the learning rate and apply the values to get the updated fitted values,
fj, k, m(xi):
Repeat steps 1-5 for each of
the
J trees in the analysis and for each of the
K levels of the response variable.
 ,
takes the following values: {-1, 1}.
,
takes the following values: {-1, 1}.
 is the number of events and
  is the number of nonevents.


 :
:
 is a vector that represents the
ith row of the predictor values in the training data.
is a vector that represents the
ith row of the predictor values in the training data.
 where
where


 for all cases in terminal node
m at tree
j
for all cases in terminal node
m at tree
j
 is the number of cases where the response value is
k and
N is the number of rows in the training data.
is the number of cases where the response value is
k and
N is the number of rows in the training data.


 ,
,
 ,
the number of trees in the analysis, and
,
the number of trees in the analysis, and  ,
the number of levels of the response variable:
,
the number of levels of the response variable: 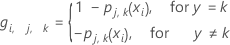
 is a vector that represents the
ith row of the predictor values in the training data
set.
For example, the probability for an outcome coded as 1 from a multinomial response with 3 levels has the following form:where
is a vector that represents the
ith row of the predictor values in the training data
set.
For example, the probability for an outcome coded as 1 from a multinomial response with 3 levels has the following form:where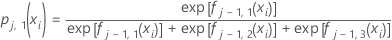
 is the fit for the
ith row at the
j–1 tree for the
kth level of the response variable.
is the fit for the
ith row at the
j–1 tree for the
kth level of the response variable.


 for all cases in terminal node
m at tree
j.
for all cases in terminal node
m at tree
j.