In This Topic
What is a multi-vari chart?
A multi-vari chart is a graphical representation of the relationships between factors and a response, and are especially useful in understanding interactions. Minitab draws multi-vari charts for up to four factors. The chart displays the means at each factor level for every factor.
Example of a two-factor multi-vari chart
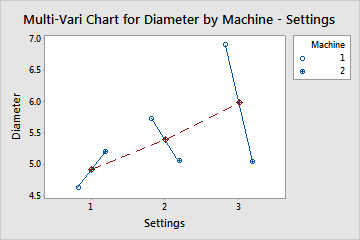
Blue symbols represent the pipe diameter means for each machine. Red symbols represent the pipe diameter means for each setting. The variation in diameters between the machines is much larger for setting 3 than with the other settings. There seems to be an interaction between settings and machines.
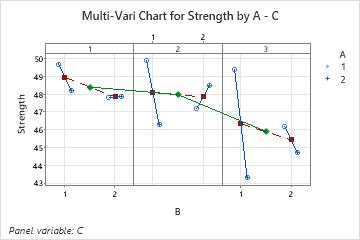
Example of a three-factor multi-vari chart
- Each panel represents one level of Factor C. The green diamonds represent the means for each level of factor C. The green line connects the factor C level means.
- Each panel has 2 sections that correspond to each level of the factor B. The red squares represent the means for each level of factor B. The red-dashed line connects the factor B level means.
- Each section has a set of symbols that correspond to each level mean for factor A. The different symbols represent each level of the third factor. The blue-solid line connects the factor A level means.
What is an interaction?
Two factors interact if the effect of one factor on the response depends on the level of the other factor. An interaction between factors A and B would be denoted AB.
For example, suppose there are two routes you can drive home. One is the expressway and the other is a side road. Both routes have about the same distance, but the speed limit on the expressway is much higher. When traffic is light, the expressway takes much less time than the side road. But at rush hour, the traffic on the expressway slows so much that the side road is actually faster.
This is an example of an interaction between the two factors, route and time of day, where the response is the time home. In fact, this is the most extreme form of interaction, where the direction of an effect changes depending on the level of another factor. It would still be considered an interaction if the expressway was always the fastest route but the advantage was reduced at rush hour.
| Non-rush hour | Rush Hour | |
|---|---|---|
| Expressway | 30 minutes | 1 hour |
| Side Road | 45 minutes | 45 minutes |
You can also have three- and four-way interactions, which are more complicated to interpret.