In This Topic
Plotted points
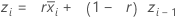
To get started, the EWMA for subgroup 0 is set to the mean of all data. By changing the weight used and the number of σ's for the control limits, you can construct a chart with specific properties. Combinations of these two parameters are often chosen by using an ARL (average run length) table. See Lucas et al.1 for the table of average run lengths.
Notation
| Term | Description |
|---|---|
| r | weight |
 | mean of subgroup i |
Center line
The center line represents the process average, μ. If you do not specify an historical value for μ, then Minitab uses the mean of all observations,  , to estimate μ.
Control limits
If you do not specify a historical value for the process standard deviation, σ, then Minitab estimates σ from your data using the specified method.
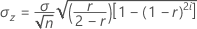
Standard deviation of the plotted points 

-
For the first subgroup (
 ),
),  is calculated as follows:

-
For subsequent subgroups (
 ),
),  is calculated as follows:
When subgroup sizes are constant, the equation simplifies to the following:
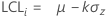
Lower control limit (LCL)
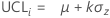
Upper control limit (UCL)
Notation
| Term | Description |
|---|---|
| ni | size of subgroup i |
| r | weight of EWMA |
| μ | process mean |
| k | parameter for Test 1. The default is 3. |