To create a scatterplot with connect lines and groups, complete the steps for the option that best describes your data.
Groups are defined by values in categorical variables
Complete the following steps if your groups are defined by values in a grouping variable, or unique combinations of values in multiple grouping variables.
- Specify the pairs of variables to appear on your graph.
- In Y variables, enter a column of Y values.
- In X variables, enter a corresponding column of X values. For a scatterplot with connect lines, the X variable usually contains time or date values.
- In Categorical variables for grouping (0-3), enter up to three columns that define the groups.
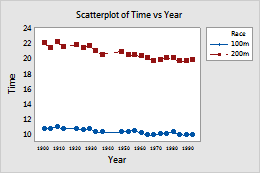
In this worksheet, Time is the Y variable and Year is the X variable. Race is the categorical variable for grouping. The graph shows the winning times for each race by year, with connect lines.
| C1 | C2 | C3 |
|---|---|---|
| Year | Time | Race |
| 1900 | 10.8 | 100m |
| 1900 | 22.2 | 200m |
| 1904 | 10.8 | 100m |
| ... | ... | ... |
Groups are pairs of X-Y variables
Complete the following steps if you have multiple pairs of numeric or date/time columns and each pair is a group.
- Specify the pairs of variables to appear on your graph.
- In Y variables, enter multiple columns that contain Y values.
- In X variables, for each Y variable, enter a corresponding column of X values. For a scatterplot with connect lines, the X variable usually contains time or date values.
- Select X-Y pairs form groups.
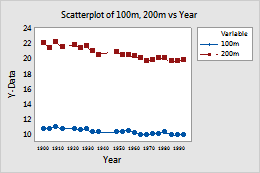
In this worksheet, 100m is the first Y variable and Year is the corresponding X variable. 200m is the second Y variable and Year is the corresponding X variable. Each set of Y and X variables forms a group. The graph shows the winning times for the 100m and 200m races over time, with connect lines.
| C1 | C2 | C3 |
|---|---|---|
| Year | 100m | 200m |
| 1900 | 10.8 | 22.2 |
| 1904 | 10.8 | 21.6 |
| 1908 | 11.0 | 22.4 |
| ... | ... | ... |