Graph > Interval Plot > One Y > Simple or Stat > ANOVA > Interval Plot > One Y > Simple
In Graph variables, enter one or more numeric or date/time columns that you want to graph. By default, Minitab creates a separate graph for each variable.
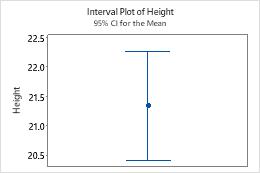
In this worksheet, Height is the graph variable. The graph shows the confidence interval for the mean of the heights.