A quality engineer at a company that makes plastic pipes is concerned about the consistency of the pipe diameters. The engineer measures 10 pipes a week for three weeks from each of two machines.
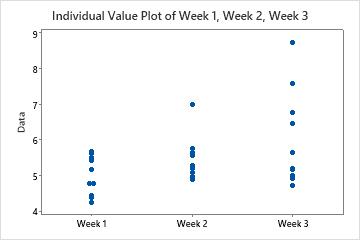
As part of the initial investigation, the engineer creates an individual value plot to compare the diameters of the pipes measured each week.
- Open the sample data, PipeDiameter.MWX.
- Choose .
- In Graph variables, enter Week 1, Week 2, and Week 3.
- Click OK.
Interpret the results
The spread of the distribution of diameters appears to increase each successive week.